Figure 3.
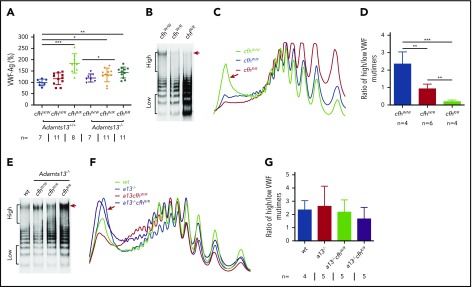
Plasma VWF antigen and multimer distribution in mice with various genotypes. (A) Plasma levels of VWF antigen in mice with various genotypes. Dots and horizontal lines represent the individual, the mean values, and ± SD. The Mann-Whitney U test was performed to compare the difference of VWF antigen between the wt or Adamts13−/− mice with each of the other experimental groups. Representative images of (B,E) VWF multimers, (C,F) densitometric scanning, and (D,G) the ratios of high to low molecular VWF forms, respectively, in mice with various genotypes. The data in panels D and G are the mean ± SD. Mann-Whitney U analysis was performed to determine the statistical significance among various groups. *P < .05, **P < .01, and ***P < .005, respectively.

