Figure 1.
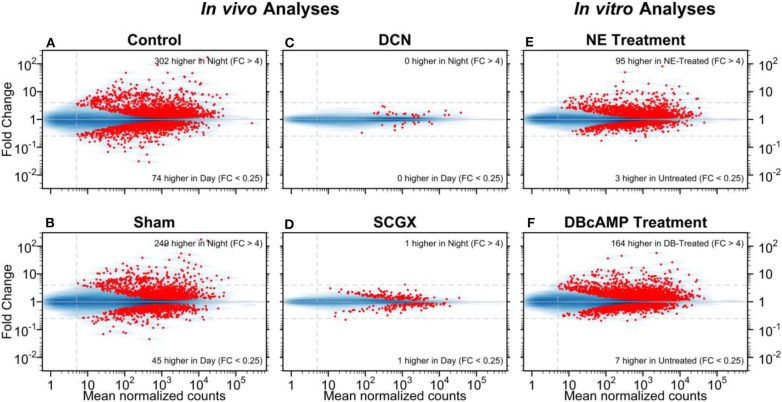
Day/night differences in gene expression. The mean normalized read-pair counts (x-axis) vs. the estimated fold change (y-axis) are displayed on a log-log scale. Four in vivo and two in vitro analyses are presented as MA plots. The blue shading indicates the density of genes, and each red point represents a gene with statistically significant differential expression (adjusted-p < 0.001). Dashed horizontal lines mark 4-fold changes in both directions; the dashed vertical line indicates the minimum abundance threshold for the statistical tests. The four in vivo analyses compared night and day time points in adult rats for the following groups: (A) no surgery (Control); (B) neonatal sham surgery (Sham); (C) neonatal superior cervical ganglia decentralization (DCN); (D) neonatal superior cervical ganglionectomy (SCGX). The two in vitro analyses compared treated/untreated pineal glands: (E) norepinephrine-treated (NE) vs. untreated and (F) dibutyryl-cyclic-AMP-treated (DBcAMP) vs untreated. Reproduced from Hartley et al. (25). This figure and associated legend is published with permission of the original publisher under license CC0.1.0.

