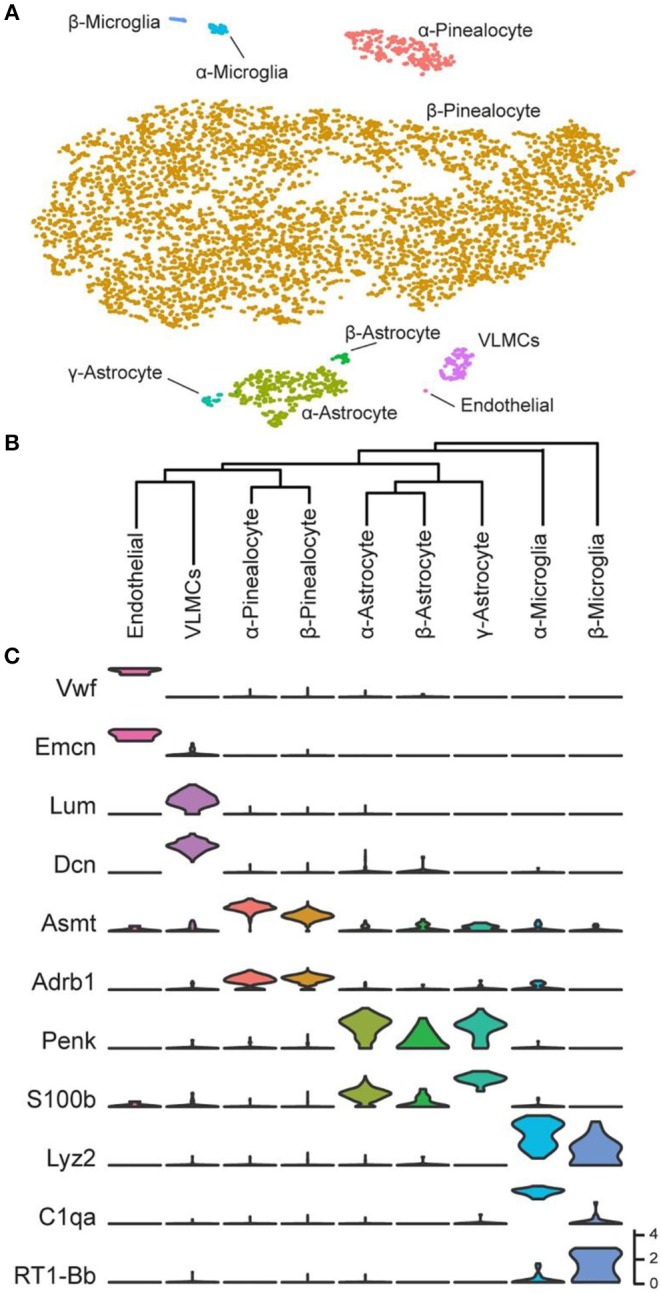
Figure 2.

Transcriptomic characterization of cell types in the daytime rat pineal gland. (A) t-Distributed stochastic neighbor embedding (t-SNE) visualization of over 5,000 daytime rat pineal gland cells as profiled by scRNA-seq. Cell types are color-coded by cluster. (B) Hierarchical clustering dendrogram showing cell type transcriptomic similarity, including two pinealocyte subtypes, the three astrocyte subtypes, the two microglia subtypes, and two vascular-associated cell types: VLMCs and endothelial cells. (C) Violin plots of marker genes for cells from each cell type. Y-Axis is natural log of normalized counts. Reproduced from Mays et al. (43). This figure and associated legend is published with permission of the original publisher under license CC0.1.0.
