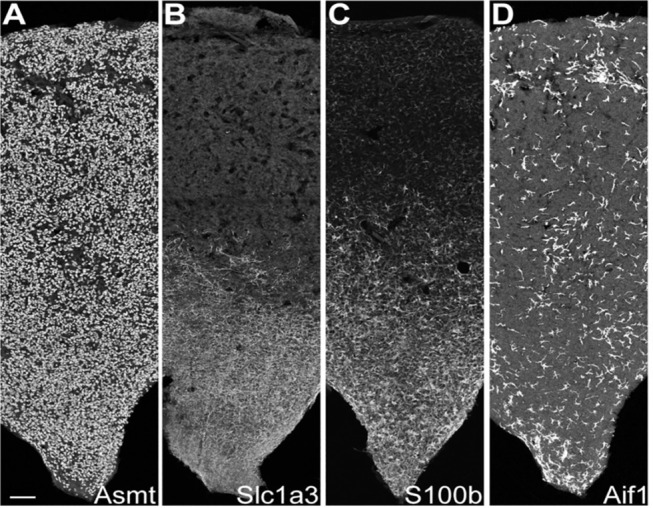
Figure 3.

IHC reveals cell type-specific patterns of expression. IHC sections through the rat pineal gland midline; rostral stalk origin at the bottom. The length and middle third of the width of the gland appear. Scale bar = 100 μm. (A) Uniform distribution of ASMT-positive pinealocytes. (B) Slc1a3-positive γ-astrocytes abundance is greatest in rostral/stalk region. (C) S100b-positive cells are abundant in the rostral region; they appear elsewhere with distinctly lower density and weaker expression strength. (D) Aif1-positive cells are unevenly distributed throughout pineal gland at low density. See Figure S6 in Mays et al. (43) for full images and further details. Reproduced from Mays et al. (43). This figure and associated legend is published with permission of the original publisher under license CC0.1.0.
