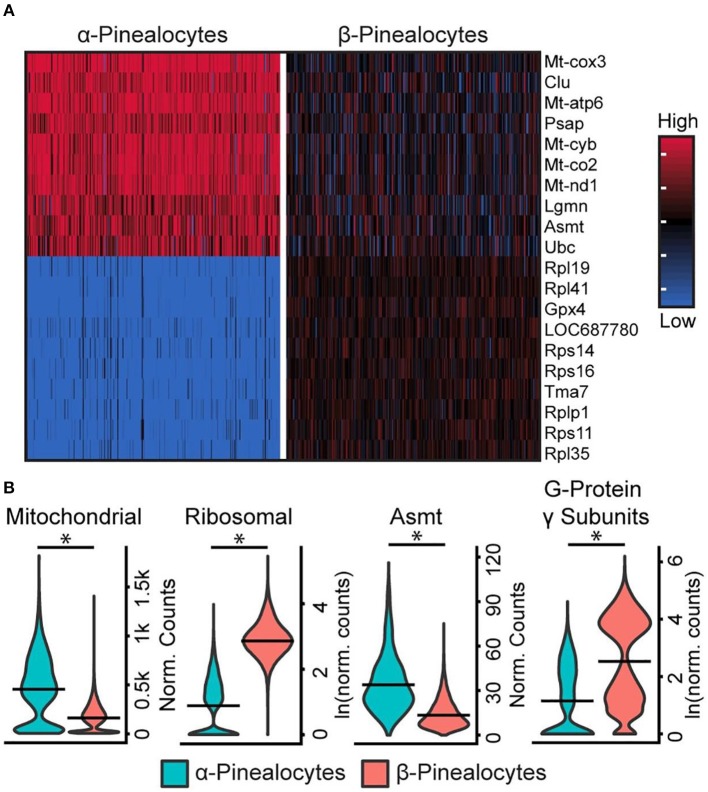
Figure 4.
scRNA-seq reveals two transcriptionally distinct pinealocyte populations. (A) A heatmap of expression values for the top 10 most differentially expressed genes (by effect size) for α- and β-pinealocytes. Values are Z-scores of counts calculated between all cells of both cell types. Each column represents one cell: random samples of 250 cells per cell type are presented. (B) Violin plots of expression distribution differences between two pinealocyte subtypes for three functional groups and one gene, Asmt. Y-Axis is either normalized counts or natural log (ln) of normalized counts. Horizontal lines represent the mean. *p < 0.001, Wilcoxon rank sum test. All cells from each subtype are included (α-pinealocyte, n = 275; β-pinealocyte, n = 4,822). Mitochondrial group includes differentially expressed mitochondrial OxPhos genes (p < 0.05, N = 12, fold change ≥2.0), ribosomal group includes top 20 most differential ribosomal genes by effect size (p < 0.05, fold change ≥2.0), G-protein γ-subunits include Gngt1, Gngt2, Gng10, and Gng13 [see Figure S5 in (43) for individual genes]. Reproduced from Mays et al. (43). This figure and associated legend is published with permission of the original publisher under license CC0.1.0.

