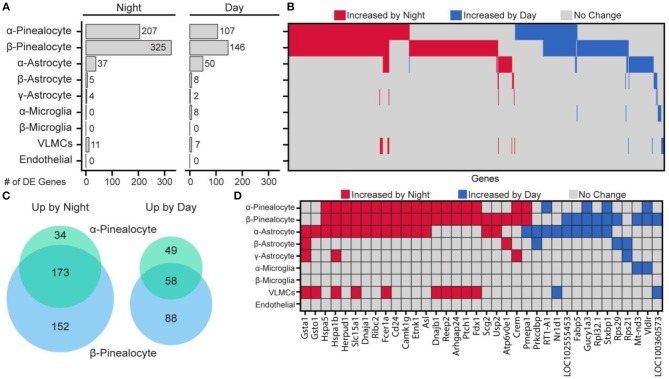
Figure 6.
Changes in gene expression between day and night occur in a cell type-specific manner. (A) Number of differentially expressed (DE) genes upregulated by night or day by cell type. DE is p < 0.01 (Wilcoxon rank sum), when expressed in at least 15% of cells in either of the two samples being tested, fold change ≥ 2.0, and effect size ≥ 0.35. (B) Heatmap summary of all 644 DE gene changes by cell type. Each column represents one gene. (C) Venn diagram of number of overlapping DE genes in α- and β-pinealocytes by day and night. (D) Heatmap summary of DE genes found in at least one non-pinealocyte and one other subtype. See also dot plots in SI of Mays et al. (43). Reproduced from Mays et al. (43). This figure and associated legend is published with permission of the original publisher under license CC0.1.0.

