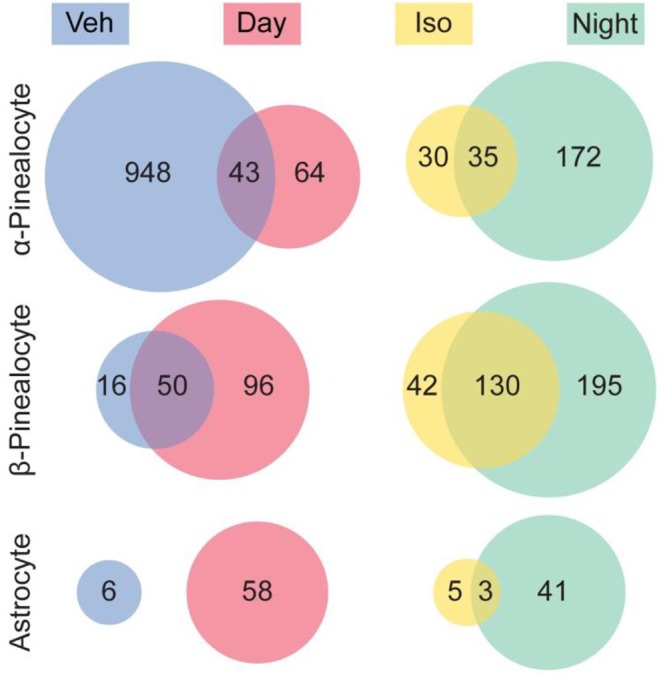
Figure 7.

Comparison of differentially expressed genes between the night time pineal gland and isoproterenol-treated pineal gland. Venn diagrams indicate the number of genes that were significantly differentially expressed (DE) in the pineal gland. There was overlap between genes exhibiting DE upregulated at night and by isoproterenol (Iso) treatment, as well as overlap between genes exhibiting DE upregulated during the day and upregulated in the vehicle control treated (i.e., downregulated by isoproterenol treatment), in 3 cell types. Other cell types are not shown. Reproduced from Mays et al. (43). This figure and associated legend is published with permission of the original publisher under license CC0.1.0.
