Figure 3.
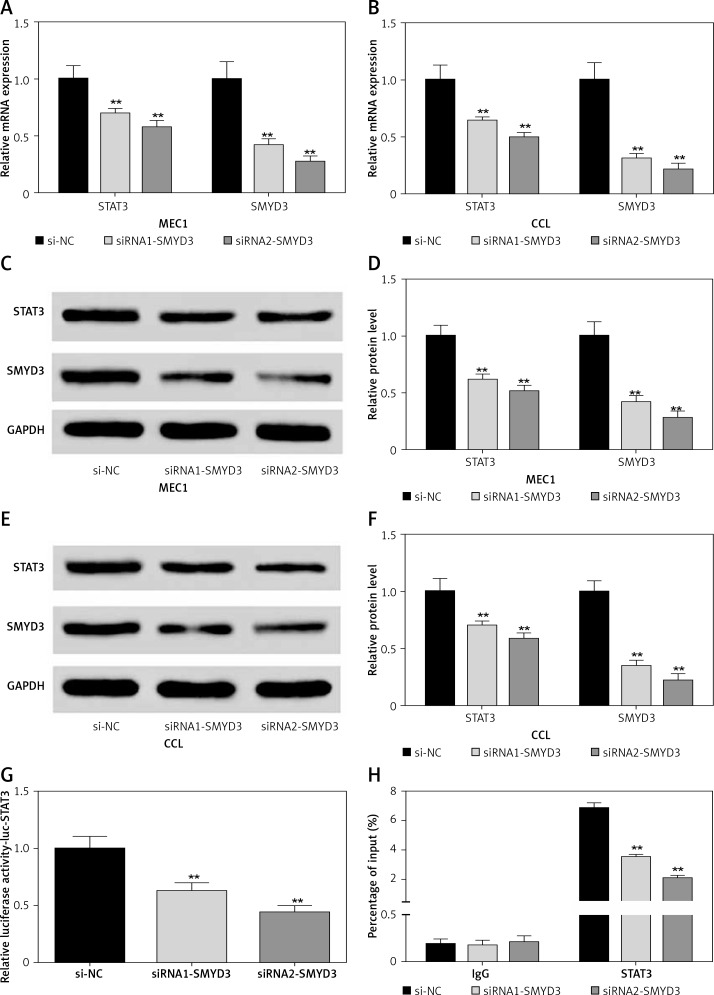
Knockdown of SMYD3 restrained expression of STAT3. Cells were plated into multi-well plates and divided into 3 groups to apply different transfection. si-NC group represents transfection with scramble siRNA, siRNA1-SMYD3 group transfection with siRNA1- SMYD3, siRNA2-SMYD3 group transfection with siRNA2-SMYD3. A – mRNA expression of STAT3 and SMYD3 in MEC1 cell line was detected by RT-qPCR. B – mRNA expression of STAT3 and SMYD3 in CCL cell line was detected by RT-qPCR. C, D – protein expression of STAT3 and SMYD3 in MEC1 cell line was detected by western blotting. E, F – Protein expression of STAT3 and SMYD3 in CCL cell line was detected by western blotting. G – mRNA correlation between STAT3 and SMYD3 was investigated through luciferase reporter experiment. H – Protein correlation between STAT3 and SMYD3 was investigated through co-immunoprecipitation experiment. Normalized by IgG
Data are means ± SD. **P < 0.01, compared with si-NC group.

