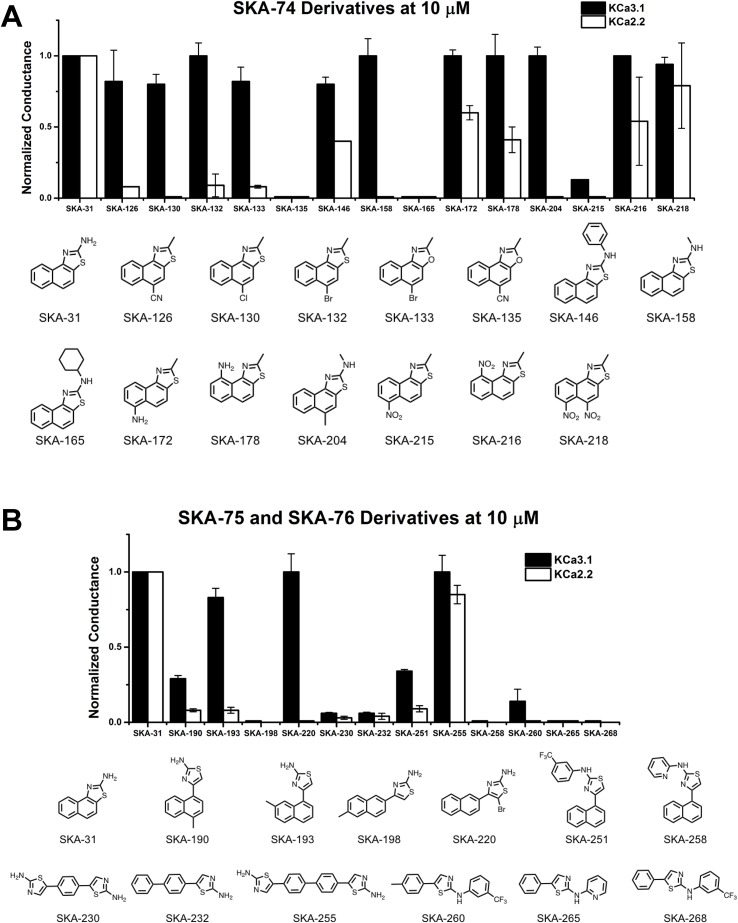
Figure 4.
Whole-cell KCa3.1 and KCa2.2 responses elicited by 10 µM of activator and normalized to 10 µM of the mixed activator SKA-31. Experiments were performed by automated electrophysiology with 250 nM of free internal Ca2+. In each experiment the new activator was tested first, washed out with 2 saline additions, and then SKA-31 was applied as positive control for normalization of the response. (A) Screening of SKA-74 derivatives. (B) Screening of SKA-75 and SKA-76 derivatives. The bar graphs show means ± SD of the slope conductance measured between −85 and −65 mV (n = 2–7 cells). Chemical structures are shown below the bar graphs.

