Figure 7.
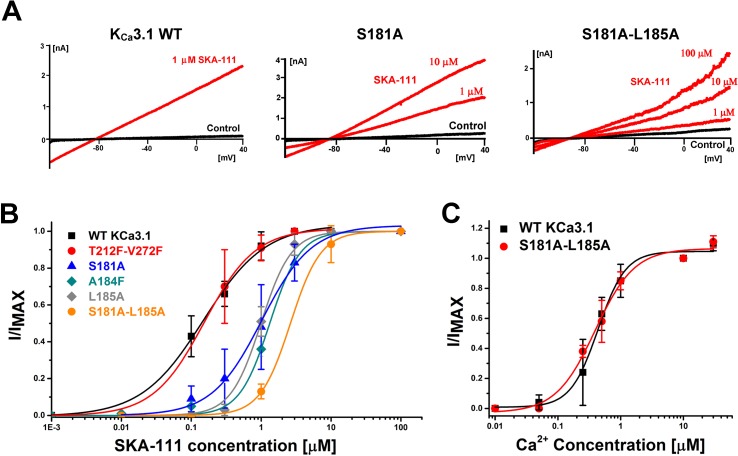
Mutations of S181 and L185 in the S45A helix disturb SKA-111 activity but not calcium gating. (A) Representative whole-cell WT and mutant KCa3.1 currents with an intracellular free calcium concentration of 250 nM in the presence and absence of SKA-111. (B) Concentration–response for SKA-111 induced current activation: WT (EC50 = 146 nM, 95% CI: 99–193 nM), T212F-V272F (EC50 = 153 nM, 95% CI: 114–182 nM, P = 0.1017), S181A (EC50 = 1.012 µM, 95% CI: 0.780–1.244 µM, P < 0.0001), A184F (EC50 = 1.326 µM, 95% CI: 1.205–1.447 µM, P < 0.0001), L185A (EC50 = 0.993 µM, 95% CI: 0.903–1.083 µM, P < 0.0001), S181A-L185A (EC50 = 2.654 µM, 95% CI: 2.619–2.624 µM, P < 0.0001). Whole-cell KCa3.1 currents were elicited by voltage-ramps from −120 to + 40 mV with an intracellular free calcium concentration of 250 nM. Data points are mean ± S.D. from 3–5 independent cells/recordings. The reported P values are for an extra sum-of-squares F test (GraphPad Prism5; GraphPad Software, La Jolla, CA) to compare the curves of KCa3.1 mutants to WT. (C) Inside-out calcium concentration-response curves for WT KCa3.1 (EC50 = 437 nM, 95% CI: 353–521 nM, nH = 1.98) and the S181A-L185A double mutant (EC50 = 392 nM, 95% CI: 287-497 nM, nH = 1.39, P = 0.4951). Data points are the mean ± S.D. from 3–5 independent recordings. The calcium-sensitivity of the mutant is statistically not different from the WT KCa3.1 channel (P = 0.4951 in extra sum-of-squares F test).

