Figure 8.
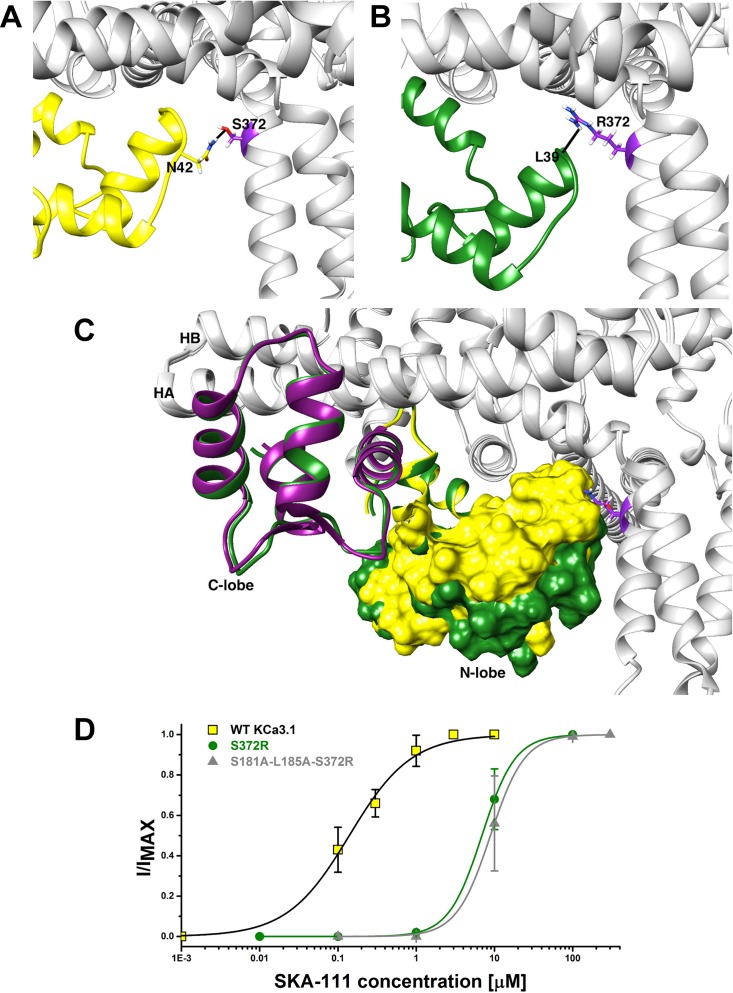
Rosetta Model of the wild type KCa3.1 channel in open state 1 with serine in position 372 (A) and of the S372R mutant (B). Hydrogen bonds are visualized in black. (C) Overlay of the Rosetta models of the S45A helix/CaM N-lobe interface pocket in the wild type (yellow) and the S372R mutant shown in space fill. (D) Concentration-response curve for SKA-111 induced current activation: WT (EC50 = 146 nM, 95% CI: 99–193 nM), S372R (EC50 = 6.860 µM, 95% CI: 6.788–6.932 µM, P < 0.0001), S181A-L185A-S372R (EC50 = 8.876 µM, 95% CI: 8.652–9.100 µM, P < 0.0001). Data points are mean ± S.D. from 3–5 independent cells/recordings.

