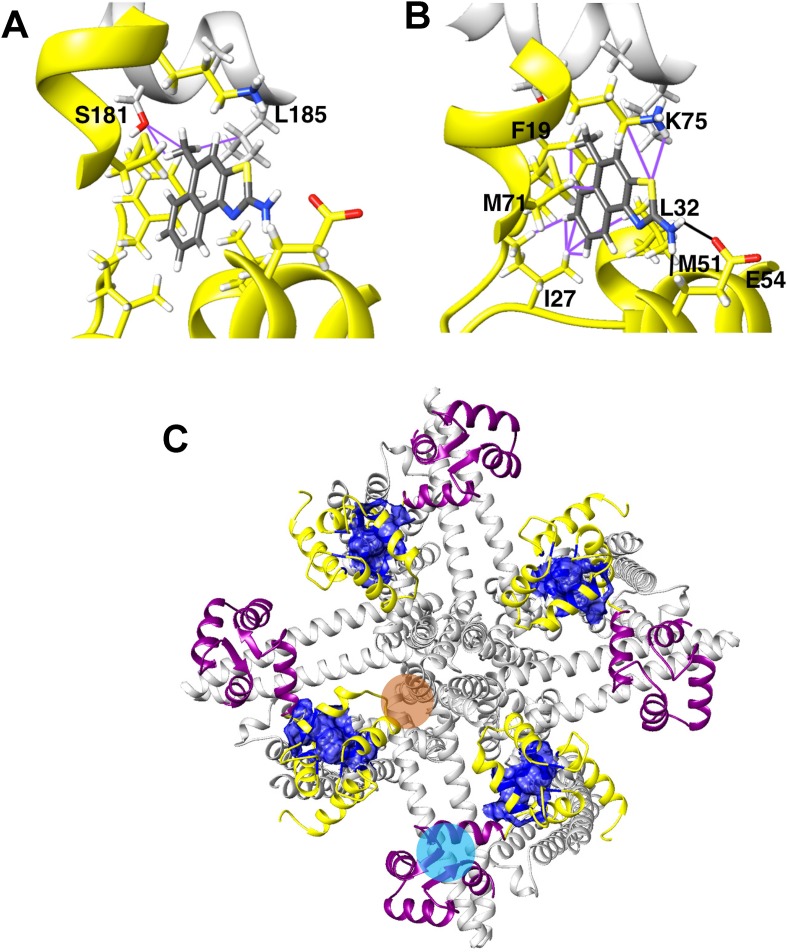
Figure 9.
Interactions between SKA-111 and residues in the KCa3.1 S45A helix (A) and the CaM N-lobe (B) interface pocket. Hydrogen bonds are indicated by black lines, van der Waals interactions are indicated by purple lines. (C) The KCa3.1-CaM channel complex seen from the intracellular side. The S45A helix/CaM N-lobe interface colored dark blue. Two other, potential binding sites for small molecules are highlighted with orange or sky-blue circles. The channel is shown in gray, the CaM C-lobe in purple and the CaM N-lobe in yellow.

