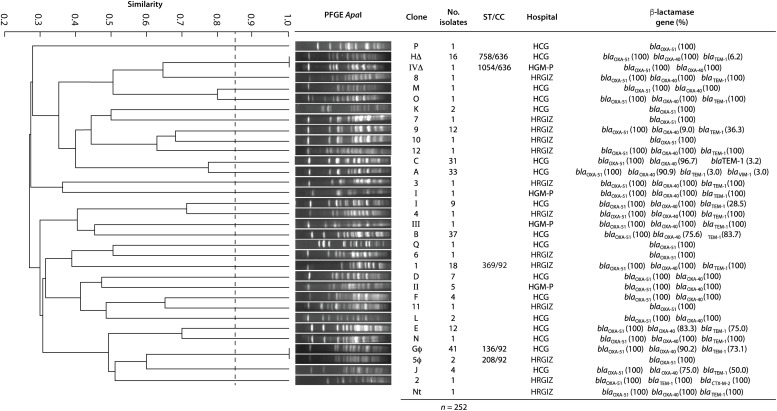
FIGURE 1.
Dendrogram generated from the analysis of 252 A. baumannii isolates from three tertiary care Mexican hospitals. A total of 202 isolates from HCG were grouped in 17 different clones, 42 isolates from HRGIZ were grouped in 12 different clones and 8 isolates from HGM-P were grouped in 4 different clones. Δ, φ: Isolates with similar PFGE profile disseminated in the three hospitals. One PFGE profile by clone was used to construct the dendrogram. The dashed line represents the 85% similarity level used in the cluster designation.

