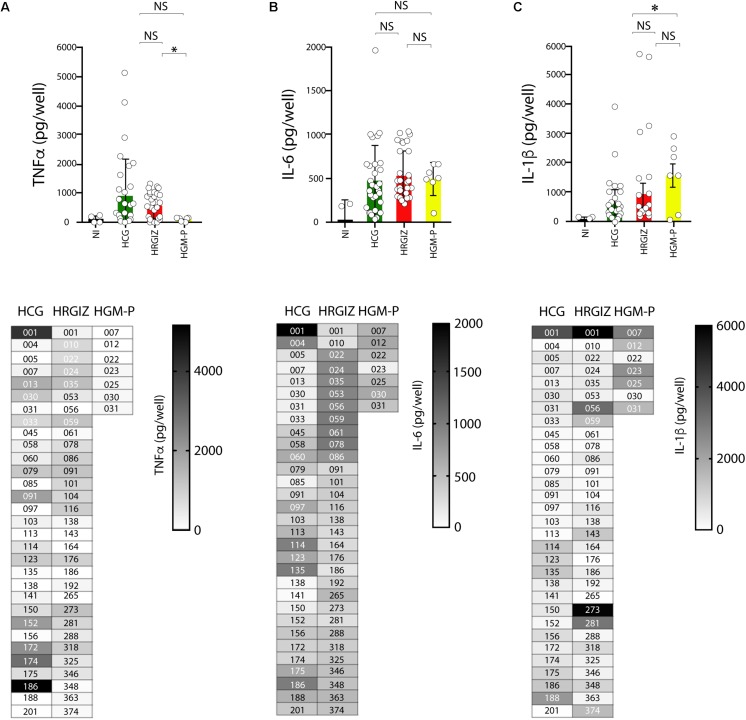
FIGURE 8.
Production of TNFα, IL-6 and IL-1β by A549 infected-cells with isolates of A. baumannii. ELISA was used to quantify TNFα (A), IL-6 (B), and IL-1β (C) release. Each open circle corresponds to the average of two independent experiments, each one in duplicated (n = 4). Each bar is plotted as the mean ± SD. Bars in upper panels indicate the TNFα (A), IL-6 (B), and IL-1β (C) released by A549 cells infected with each isolate from the HCG, HRGIZ, and HGM-P. Heat map chart in lower panels indicates the level of cytokine released by A549 infected cells. NI, non-infected. NS, non-significant; ∗p < 0.05.

