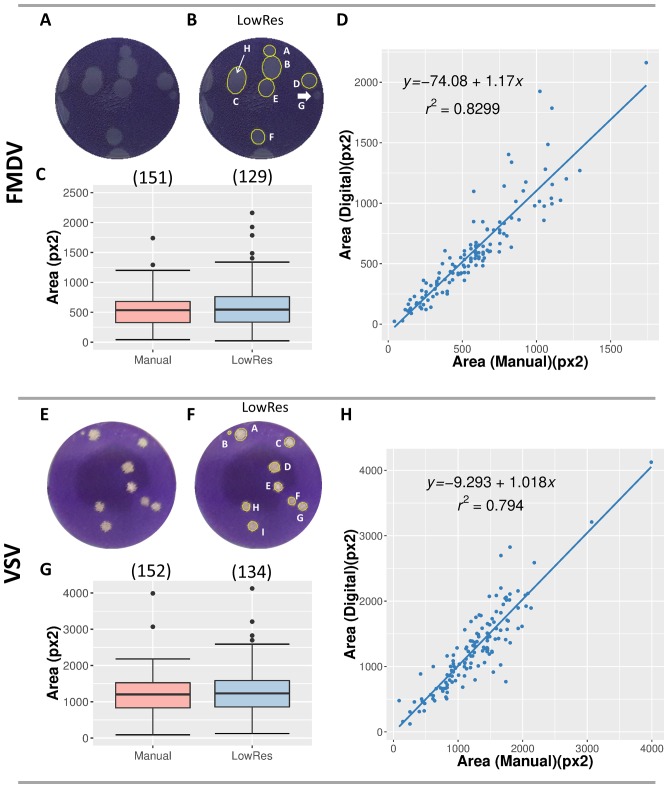
Figure 3. Comparison of plaque measurements with manual and LowRes methods.
(A–D) Analysis of 6-well FMDV plaque assays scanned using a flatbed office scanner at 150 dpi. (E–H) Analysis of 24-well VSV plaque assays digitalized using a 13 Megapixels cell phone camera. Median filter radius was increased to 8 px and Gaussian Blur filter radius was set at 2 px. The original low-resolution images (A, E) were processed with the ViralPlaque macro (B, F). The plaques detected by the macro are circled in yellow and labeled (B, F). In (B), arrows indicate plaques that were only detected manually (G and H). (C, G) Distribution of plaque areas. Box-plots represent data obtained between 10th and 90th percentiles; median area is indicated by a horizontal line. The number of plaques detected by each method is given in brackets. (D, H) Correlation between manual and digital measurements of individual plaque area. The equation of the linear least-squared fit and goodness of fit R2 is given for each method.

