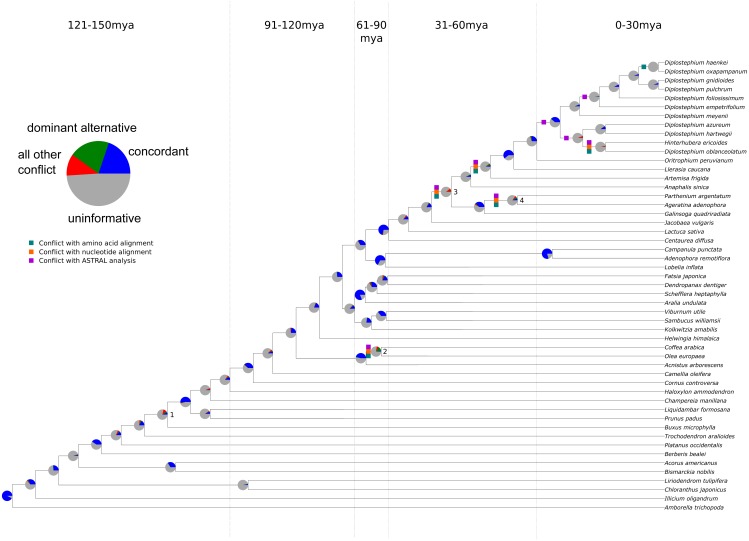
Figure 1. Summary of chloroplast conflict against the reference phylogeny of angiosperms.
Green, orange, and purple boxes indicate where the amino acid, nucleotide, or MQSST phylogenies conflict with the reference phylogeny. Pie charts depict the amount of gene tree conflict observed in the nucleotide analysis, with the blue, green, red and gray slices representing, respectively, the proportion of gene trees concordant, conflicting (supporting a single main alternative topology), conflicting (supporting various alternative topologies), and uninformative (BS < 70 or missing taxon) at each node in the species tree. The dashed lines represent 30 myr time intervals (positioned based on Magallón et al., 2015 and Vargas, Ortiz & Simpson, 2017) used to bin nodes for examinations of conflict at different levels of divergence.

