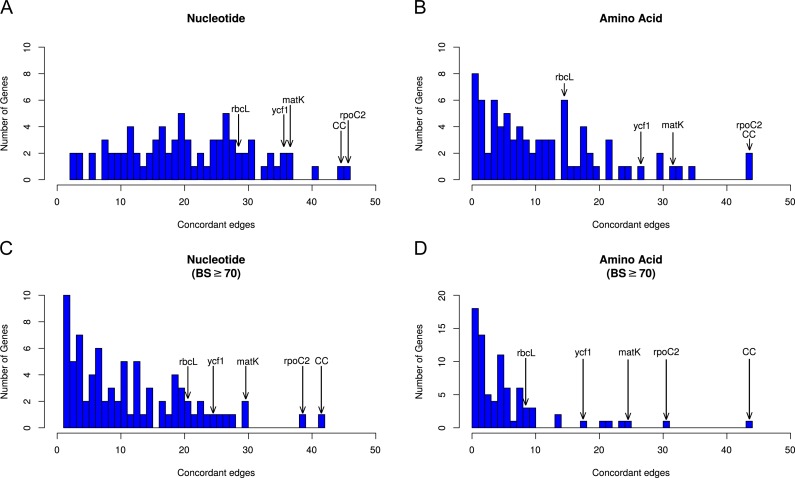
Figure 3. Histograms depicting number of concordant edges each gene tree contains compared to the reference phylogeny (i.e., the AT).
Histograms are binned by number of concordant nodes; bar heights give the number of genes in each bin. Commonly used markers (matK, ndhF, rbcL, and ycf1) are labeled on the graph, along with the most concordant gene (rpoC2) and the number of concordant nodes for the complete chloroplast (CC) compared to the AT. (A) Concordance in the nucleotide dataset not considering bootstrap support. (B) Concordance in the amino acid dataset not considering bootstrap support. (C) Concordance in the nucleotide dataset considering bootstrap support ≥ 70%. (D) Concordance in the amino acid dataset considering bootstrap support ≥70%.

