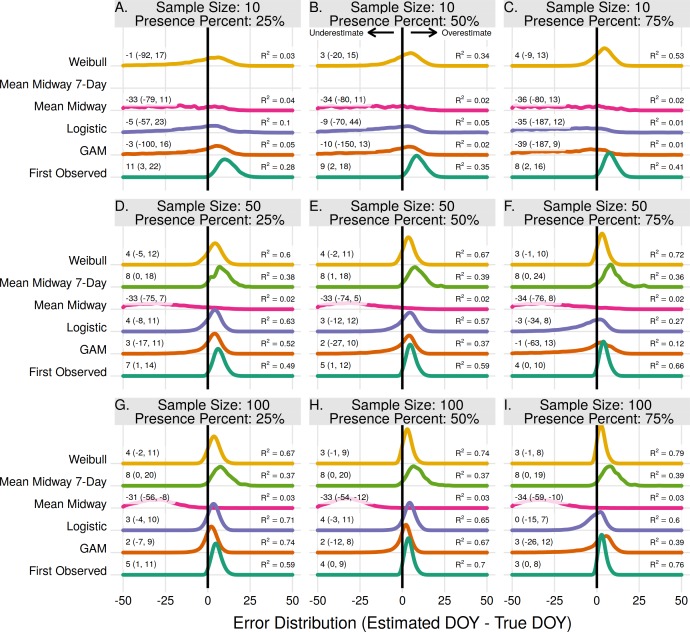
Figure 1. The error distribution of all estimators for population onset.
The panels indicate simulated sample sizes of 10 (A–C), 50 (D–F), and 100 (G–I), and presence proportions of 25% (A,D,G), 50% (B,E,H), and 75% (C,F,I). The density curves are each derived from 11,000 randomly drawn observations across eleven years of phenological data. Text values represent the median error and the 95% quantile range in parenthesis.

