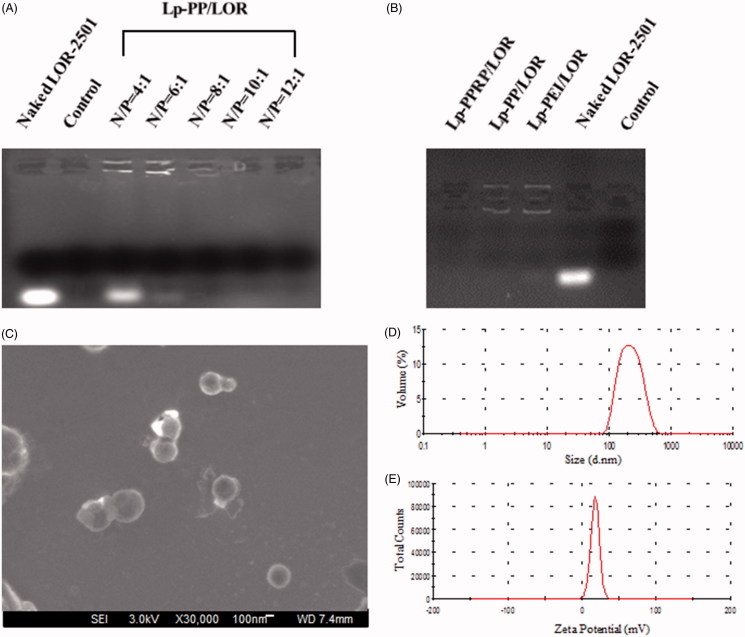
Figure 3.
Agarose gel electrophoresis retardation assay of Lp-PP/LOR, Lp-PPRP/LOR and the characterization of Lp-PPRP/LOR. (A) Agarose gel electrophoresis retardation assay of Lp-PP/LOR at varying N/P ratios. (B) Agarose gel electrophoresis retardation assay of Lp-PPRP/LOR. (C) FE-SEM image of Lp-PPRP/LOR at R8-PA/total lipid ratio = 20%. (D) Diameter distribution of Lp-PPRP/LOR at R8-PA/total lipid ratio = 20%. (E) Zeta potential distribution of Lp-PPRP/LOR at R8-PA/total lipid ratio = 20%.

