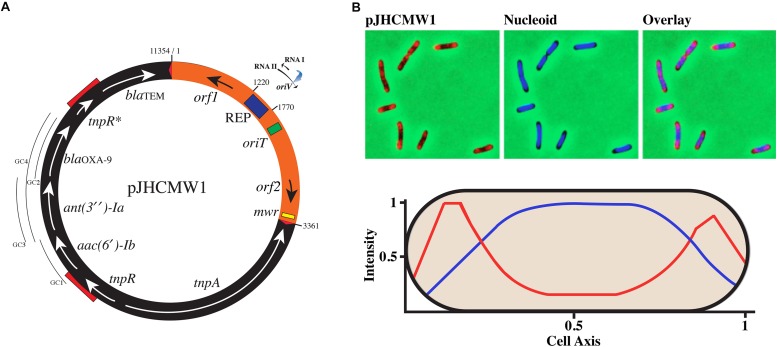
FIGURE 1.
Genetic map and subcellular localization of pJHCMW1. (A) The numbers indicate the coordinates as defined in GenBank (accession number AF479774). The region harboring the inheritance functions is shown in orange and boxes inside indicate the location of the replication region (REP) and oriT and mwr loci. The RNA I and RNA II within the replication region are shown with their transcription orientation (arrowheads). The blue arrow represents the location of RNase H digestion where DNA polymerase I initiates replication (oriV). The black arrow adjacent to REP is a gene that codes for a PH domain-containing protein of unknown function. The black arrow adjacent to the mwr site represents a gene coding for a hypothetical protein of unknown function. The black region represents Tn1331. The red triangles represent the inverted repeats (GGGGTCTGACGCTCAGTGGAACGAAAACTCACGTTAAG) and the red segments on top of the circle indicate repeated sequences most probably formed during the genesis of the transposon. The segment including one of these repeated sequences plus the region between them is the addition to Tn3 that formed Tn1331 (Tolmasky, 2000). The lines labeled as GC1, GC2, GC3, and GC4 indicate the location of the gene cassettes. GC1 and GC2 are non-functional, GC3 is poorly functional, and GC4, which includes both ant(3″)-Ia, and blaOXA–9, is fully functional (Ramirez et al., 2008). (B) The top panels show images of cells carrying the pJHCMW1 derivative pTT4 that possesses the TetO. The panel to the left shows the cells labeled using TetR-YPet to detect plasmid molecules, the center panel shows labeling with DAPI to detect the nucleoid, and the panel to the right shows an overlay of nucleoid and plasmid signals. The bottom panel shows the levels of fluorescent signals using the same colors as the top panels over a cell’s length. The values are averages of measurements from 329 cells.

