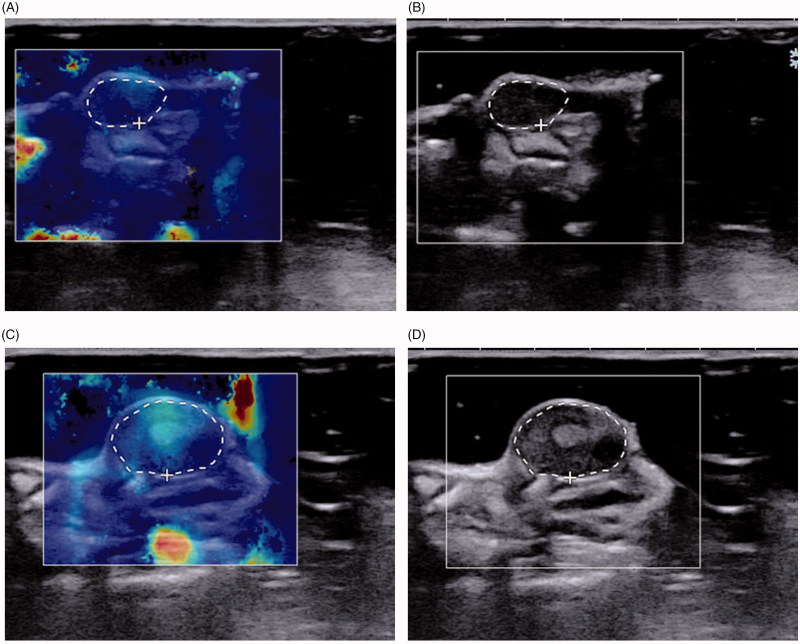
Figure 3.
SWE images of tumor in a mice treated with NET-1 siRNA TNBs that were measured on day 0 and day 21. (A, B) (day 0) MTD:5.36 mm, Emax: 24.3 kPa, Emean: 13.6 kPa. (C, D) (day 21) MTD: 8.69 mm, Emax: 39.7 kPa, Emean: 21.0 kPa. White circles correspond to the regions of interest, which contained the whole tumor of the current section, within which the max and mean stiffness values were measured.

