
Fig. 2.
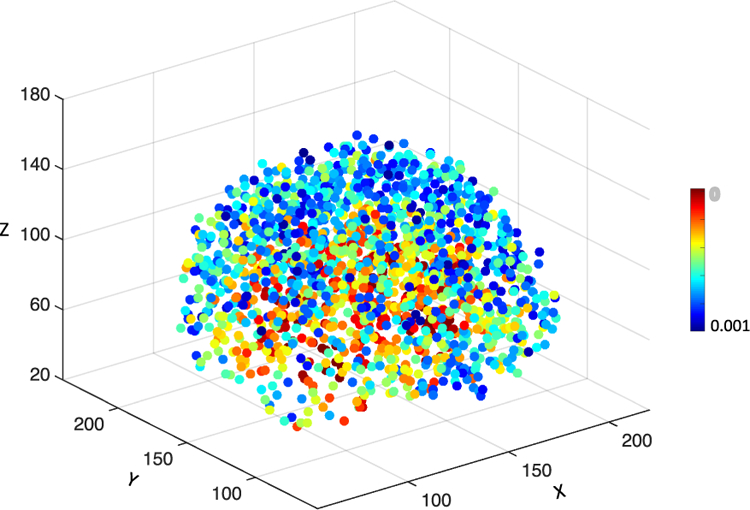
Illustration of all anatomical landmarks identified from AD and NC subjects in ADNI-1. Different colors denote p-values in group comparison between AD and NC subjects [20]. A small p-value indicates that the corresponding landmark has a high discriminative capability and vice versa.