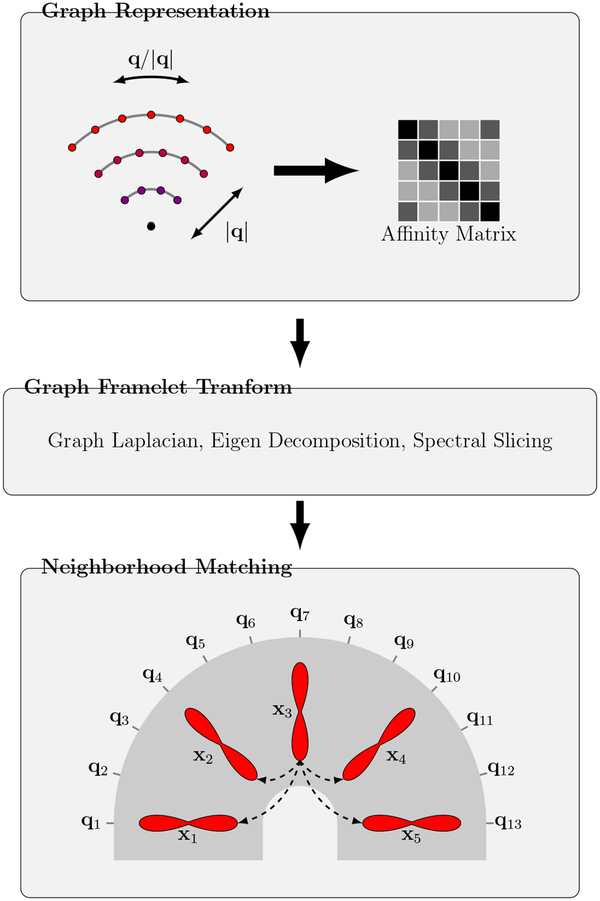
Figure 1: Overview.
(Graph Representation) Representing the q-space sampling domain using a graph with affinity matrix determined by kernels for diffusion gradient directions and strengths. (Graph Framelet Transform) Feature computation by spectral decomposition. (Neighborhood Matching) Correspondence matching in x-q space. Note that q-space is generally 3D; 2D illustration is used here for simplicity.

