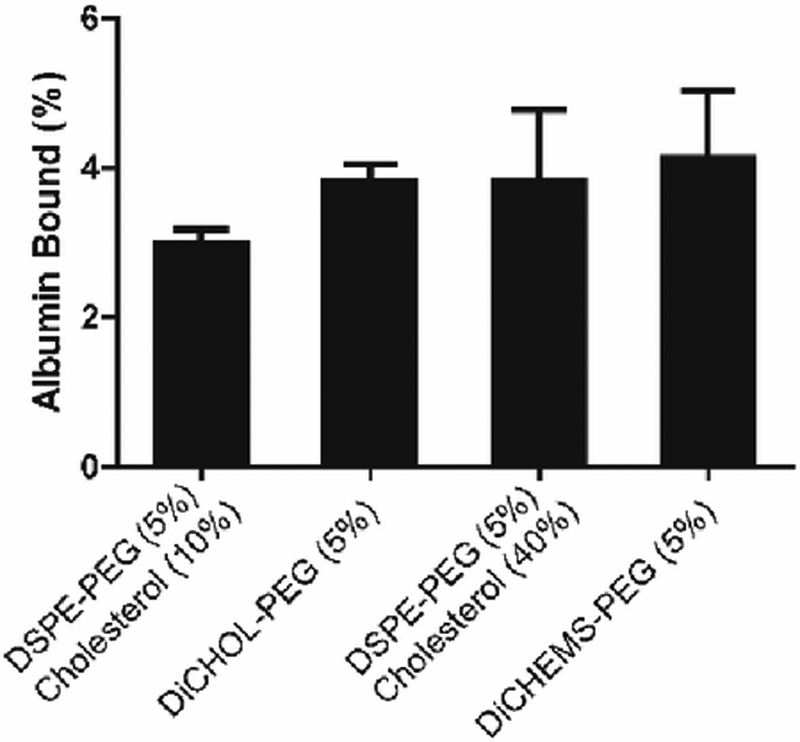
Fig. 4.
Normalized liposome protein binding. Liposome formulations exhibit minimal differences in non-specific protein binding. Percent BSA binding shows no significant changes in the levels of BSA associated with the liposomes. Protein content normalized to liposome concentration. Error bars represent mean ± SD, n=3/group. p = 0.64 ANOVA.

