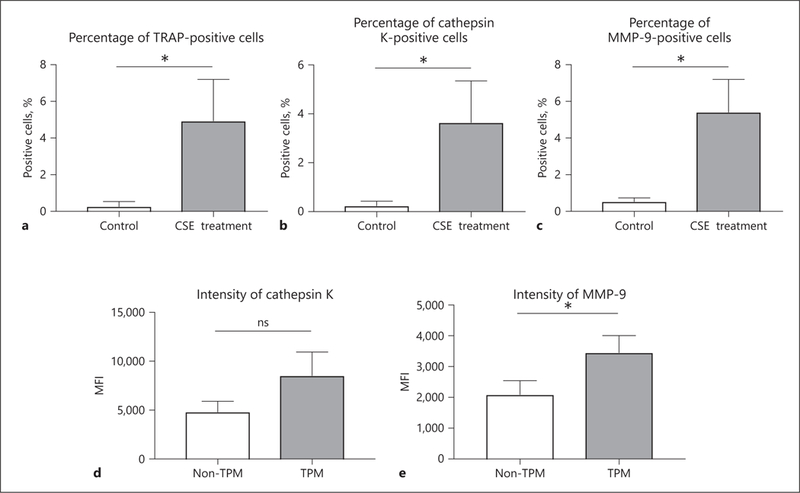
Fig. 3.

CSE treatment promotes the activation of macrophage cells. Flow cytometric analysis showed that the percentages of live cells positive for TRAP (a), cathepsin K (b), and MMP-9 (c) were higher in the CSE treatment group (cultured for 5 days) than in the nontreated group. In the CSE treatment group, TPM showed higher levels of expression of cathepsin K (d) and MMP-9 (e) compared to non-TPM. Values are presented as means ± SD for at least 3 replicates. * p < 0.05. ns, not significant; CSE, cigarette smoke extract; TRAP, tartrate-resistant acid phosphatase; MMP-9, matrix metalloproteinase-9; TPM, TRAP-positive macrophage; MFI, median fluorescence intensity; SD, standard deviation.
