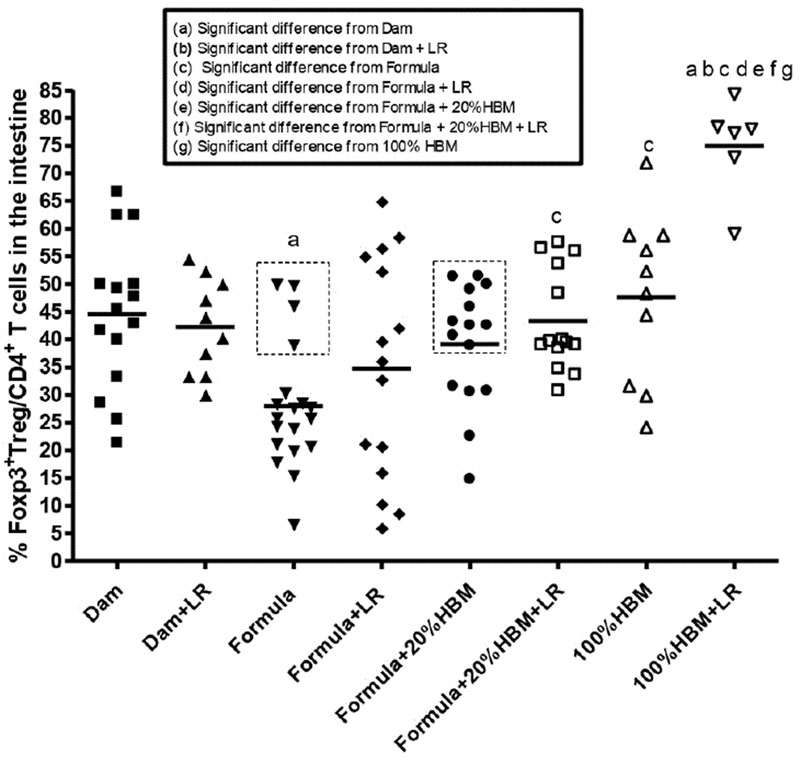
Figure 2:
Percentages of Foxp3+ LReg cells among CD4+ T cells in the ileum of newborn rats exposed to different feeding regimens. In each feeding group, a dot represents one rat. The line in each group represents the mean value. Animal numbers in groups were n=6-19. Multiple group comparisons were performed using one way ANOVA with post hoc Tukey’s test. The multiple group comparisons with significant p values (p<0.05,<0.01, or<0.001) are indicated in the Figures. Dotted rectangles indicate the numbers of rats with % of LRegs greater than or equal to the mean % of LRegs in Formula+20% HBM-fed rat pups.

