. 2019 Jul 11;10(34):7913–7922. doi: 10.1039/c9sc02298h

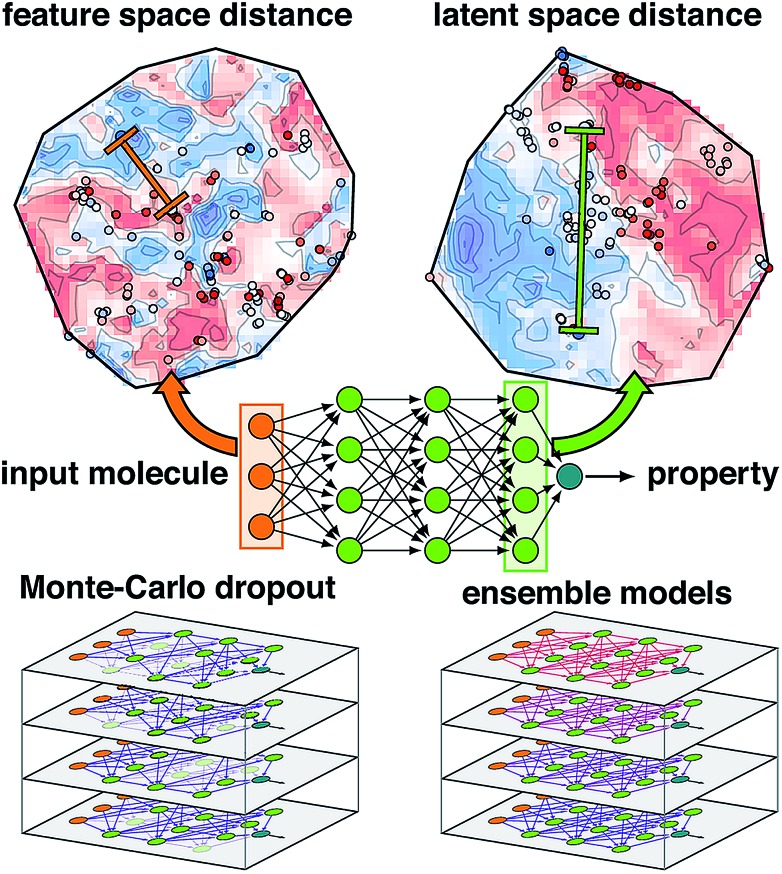
Fig. 1. Schematic of an ANN annotated with the four uncertainty metrics considered in this work. Two points are compared in terms of their feature space distance (i.e., the difference between two points in the molecular representation) on a t-distributed stochastic neighbor embedding map49 (t-SNE) of data in the input layer (top, left, annotations in orange) and the latent space distance (i.e., the difference between two points in the final layer latent space) on a t-SNE of the data in the last layer (top, right, annotations in green). The standard ANN architecture (middle) is compared at bottom for Monte-Carlo dropout (i.e., zeroed out nodes) and ensemble models (i.e., varied model weights) at bottom left and right.

Fig. 1