. 2019 Jul 11;10(34):7913–7922. doi: 10.1039/c9sc02298h

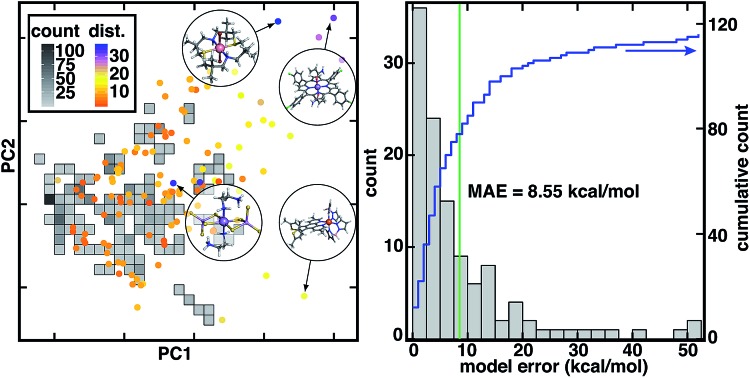
Fig. 2. (left) Comparison of inorganic training and CSD test data in the dominant two principal components of the RAC-155 representation of the training data set. The density of training data is shown as gray squares shaded as indicated in inset count colorbar. CSD test data points are shown as circles colored by the 10-nearest-neighbor-averaged Euclidean distance in RAC-155 space, as shown in dist. inset color bar. Four representative high-distance structures are shown in circle insets in ball and stick representations: (top left inset, CSD ID: FATJIT) a Co(ii) complex with S/N macrocycle and axial Br ligands, (top right inset, CSD ID: EYUSUO) Mn(ii) tetra-chlorophenyl-porphyrin with acrylamide axial ligands, (bottom left inset, CSD ID: CEDTAJ) a Mn(ii) complex with thioarsenite ligands, and (bottom right inset, CSD ID: ECODIM) an Fe(ii) complex with boronated dipyrazole and thiolated phenanthrene ligands. (right) Distribution of absolute CSD test set model errors for ΔEH-L (in kcal mol–1, bins: 2.5 kcal mol–1) with the MAE annotated as a green vertical bar and the cumulative count shown in blue according to the axis on the right.

Fig. 2