. 2019 Jul 11;10(34):7913–7922. doi: 10.1039/c9sc02298h

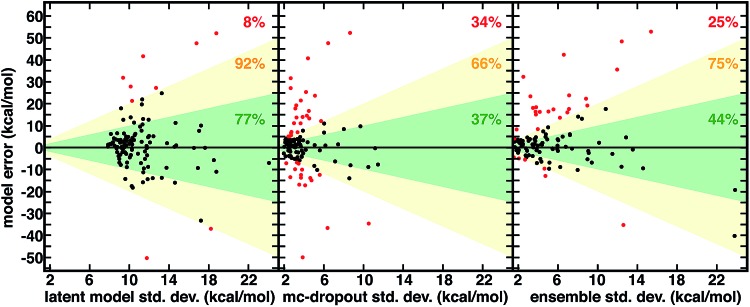
Fig. 3. Relationship between spin-splitting ANN model errors (in kcal mol–1) on a 116 molecule CSD set and three uncertainty metrics all in kcal mol–1: latent model energetic, calibrated std. dev. (left), mc-dropout std. dev. (middle), and 10-model ensemble std. dev. (right). The translucent green region corresponds to one std. dev. and translucent yellow to two std. dev. The points with model errors that lie inside either of these two bounds are shown in black, and the percentage within the green or yellow regions are annotated in each graph in green and yellow, respectively. The points outside two std. dev. are colored red, and the percentage of points in this group is annotated in each graph in red. Three points are omitted from the ensemble plot to allow for a consistent x-axis range.

Fig. 3