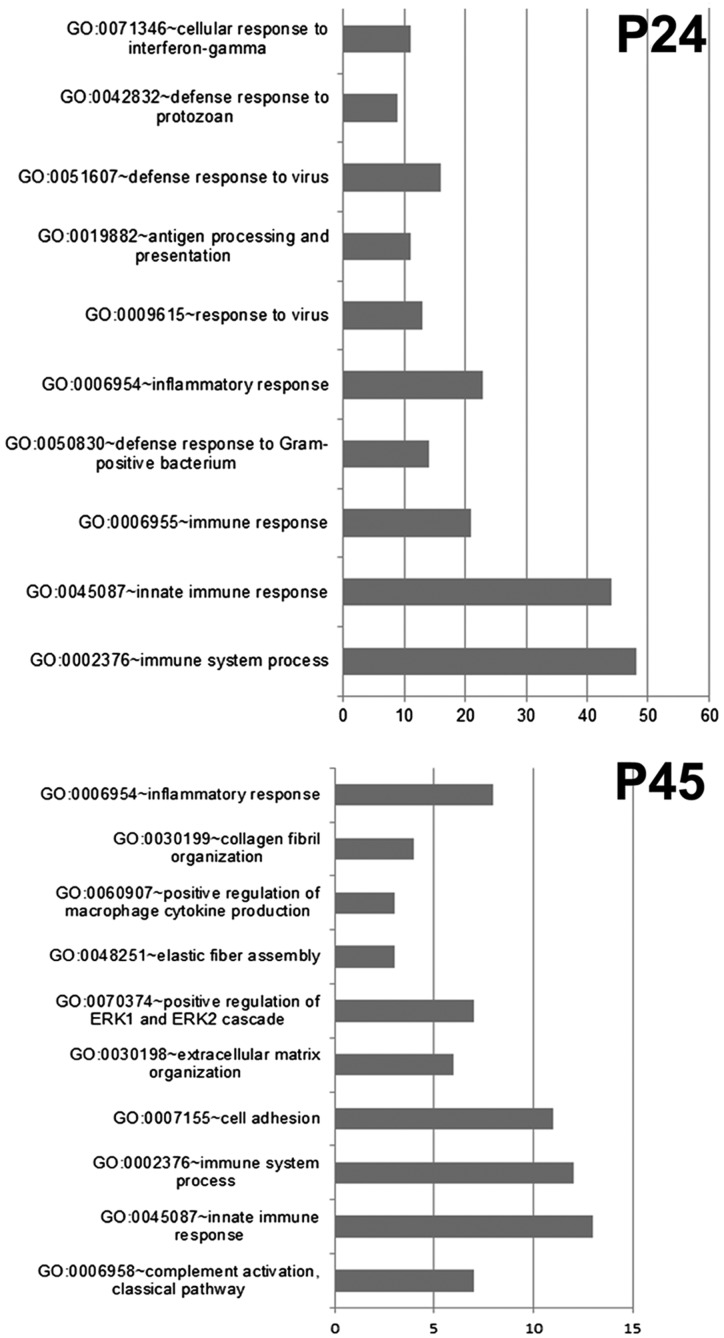
Figure 2.
DAVID plots of Gene Ontology analysis at 24 and 45 d of life. At both ages (proximal to the peaks of rod and cone degeneration, respectively), inflammation/immune response emerges as a major biologic process underlying retinal degeneration. The signatures of both innate and immune reaction are revealed by this data grouping strategy. Bars represent gene count. The GO terms plotted show FDR values well below the threshold of 0.05.

