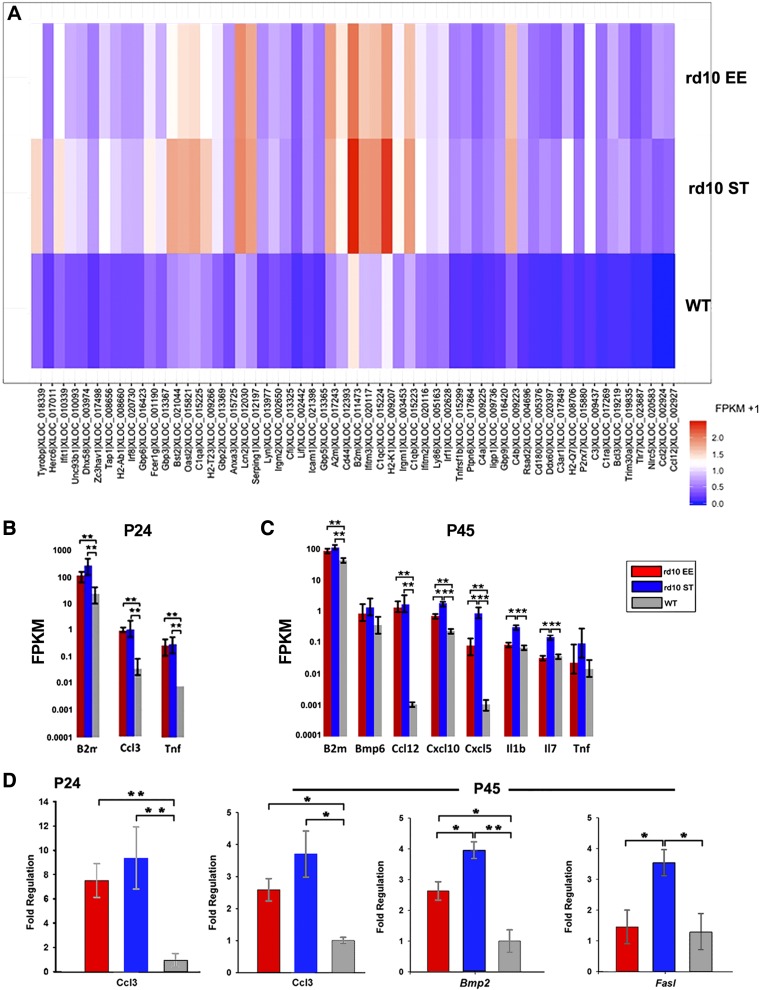
Figure 3.
Retinal inflammation in rd10 mice. A) Expression of genes of the immune response pathway chosen from GO databases selecting terms showing the highest differences in expression levels in rd10 EE, rd10 ST, and WT retinas, shown here as paired heat maps. P24 data, highly indicative, are shown. The hottest profiles are visible in the retinas of rd10 ST mice. Groups of genes show visibly lower levels of expression in EE samples. B, C) Plots from transcriptome analysis of retinas from rd10 EE, rd10 ST, and WT mice at 24 and 45 d of age showing representative samples of up-regulated genes involved in the inflammatory response (i.e., Ccl3, Il1b). These genes demonstrate a typically higher pattern of expression in rd10 ST samples, lower in healthy, WT mice and intermediate in rd10 EE animals. D) q real-time PCR at P24 and P45 detects high levels of inflammatory chemokines in all rd10 samples compared to WT but lower expression in rd10 EE samples compared to ST. FPKM, fragments per kilobase of exon per million fragments mapped. *0:01 ≤ P < 0:05, **0:001 ≤ P < 0:01, ***P < 0:001.

