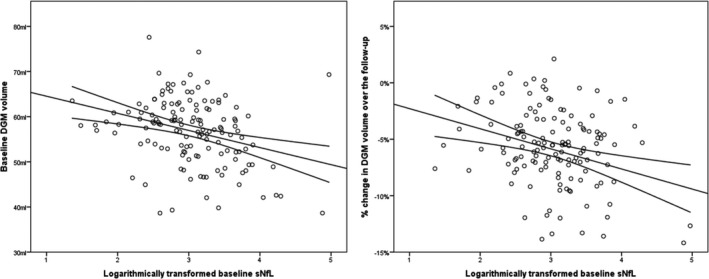
Figure 2.

Scatter plot representation of the PwMS associations between baseline sNfL and MRI–derived DGM volume at baseline and the 5‐year longitudinal change. PwMS, persons with multiple sclerosis; DGM, deep gray matter; sNfL, serum neurofilament light chain levels. Due to the data distribution of the baseline sNfL, the value was logarithmically transformed and plotted as such on the x‐axis.
