
Figure 2.
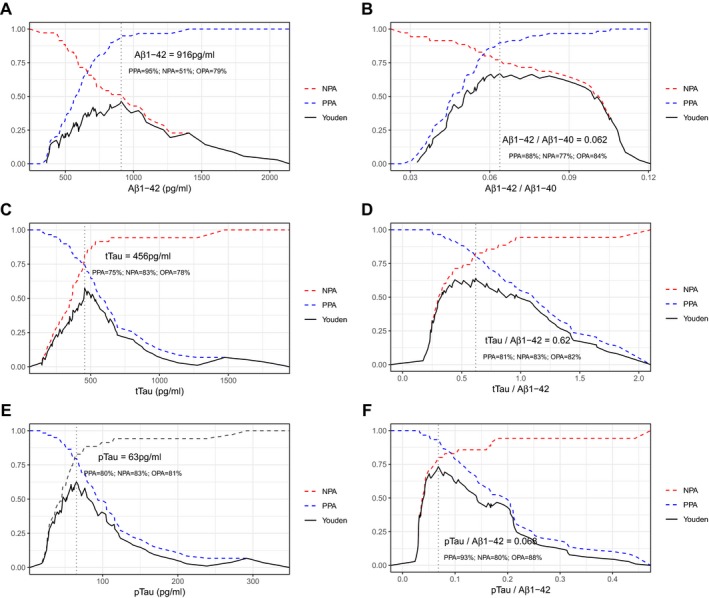
Accuracy of all possible cutoff levels of individual (A, C, E) and combined (B, D, F) CSF biomarkers. Only those biomarkers that yielded areas under the curve above 0.70 and their ratios with Aβ1‐42 are shown. Vertical dotted lines indicate cutoffs with maximum Youden J index. PPA, Positive Percent Agreement; NPA, Negative Percent Agreement; OPA, Overall Percent Agreement.