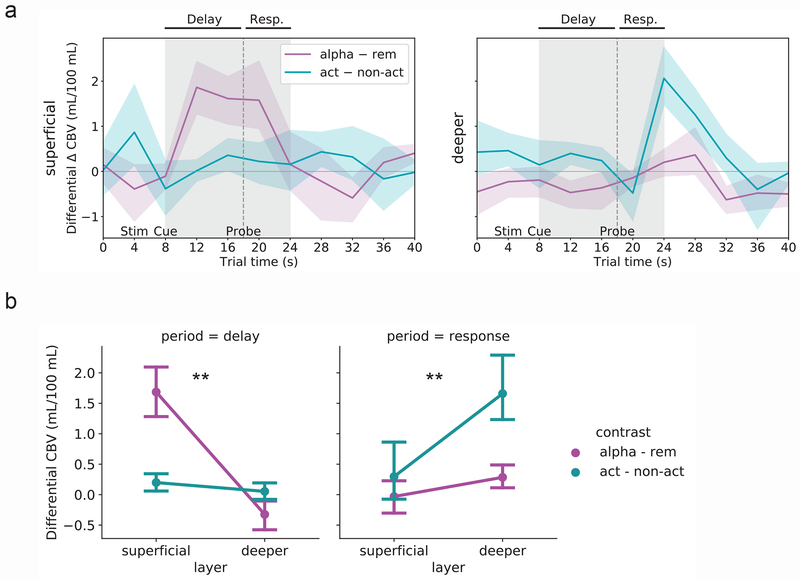
Fig. 3. Activity contrasts across layers and conditions of interest.
(A) Top: Superficial-layer VASO activity during maintenance (‘rem’) trials subtracted from activity during manipulation (‘alpha’) trials [purple line]. The largest difference can be seen during the delay period. Bottom: Deeper-layer VASO activity during non-action (‘non-act’) trials subtracted from activity during action (‘act’) trials [teal line]. The largest difference can be seen during the response period. Lines represent mean and shaded area represents 95 percent confidence intervals for the mean (determined via bootstrapping with 1,000 iterations) across n = 15 sessions (13 unique subjects; same data as in Fig. 2). See Fig. S5b for subtractions based on mean BOLD activity timecourses. (B) Two-way ANOVAs with factors layer (superficial versus deeper) and contrast (manipulation – maintenance [‘alpha – rem’, purple lines] versus action – non-action [teal lines]), for each trial period (delay and response). Dots represent mean and error bars reflect 95 percent confidence intervals for the mean (determined via bootstrapping with 1,000 iterations) across n = 15 sessions (13 unique subjects). **, interaction significant at p < 0.001 (p = 6.9e−6 and p = 3.0e−4 for the delay period [left] and response period [right], respectively).

