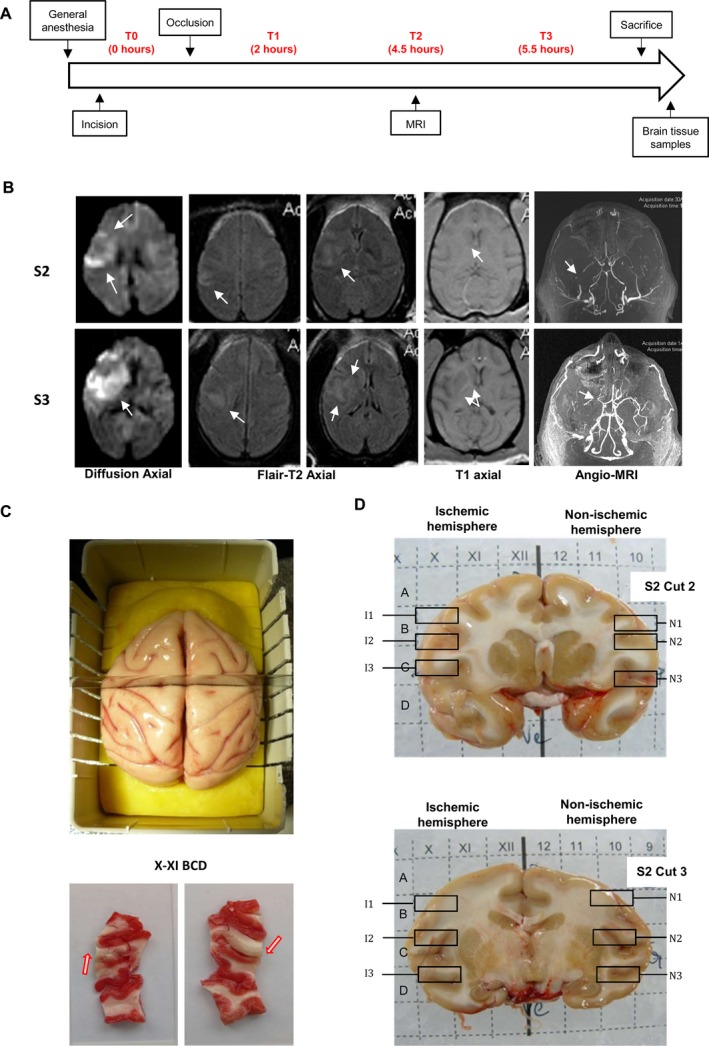
Figure 1.

Experimental design, cerebral MRI, and tissue processing. (A) Experimental design. T0 blood sample before MCA (Middle cerebral artery) occlusion and represents the time right before incision of the animal but after general anesthesia. T1, T2, and T3 were blood sample after MCA occlusion. (B) Magnetic Resonance Imaging was performed 3 h after occlusion and includes Diffusion‐weighted imaging (DWI), Flair‐T2, T1, and angio‐MRI. Note on S3 animal the hypersignal (arrow) in the cortex and caudate nucleus on DWI and Flair‐T2 imaging. On S2 animal, the volume appears to be smaller compared to S3 either on DWI or Flair‐T2. Angio‐MRI of Willis circle showed the absence of arterial flux on right MCA artery (arrow) compared the left one. (C) Tissue processing. Upper part: brain placed into a mold for coronal brain slicing; Lower part: Adjacent cut of cortex (between column X and XI extending on three lines: BCD) studied for metabolic activity by triphenyltetrazolium chloride (TTC). Healthy tissue appeared in pink and ischemic cortex in white (arrow). Absence of TTC reflecting ischemia is differentiated from juxtacortical white matter (myelin). (D) Brain samples for Microarrays. Two coronal cuts of S2 brain (C2 and C3), taken as example, were placed onto a grid to identify X and Y coordinates. Arbitrarily, the Roman numeral was for the right ischemic brain and Arabic numerals for the left nonischemic hemisphere. (A–D) represent the different line. I1 (XB), I2 (XC) and I3 (XD) represent brain sample from the ischemic cortex and N1, N2, N3 represent the homologous nonischemic cortex samples.
