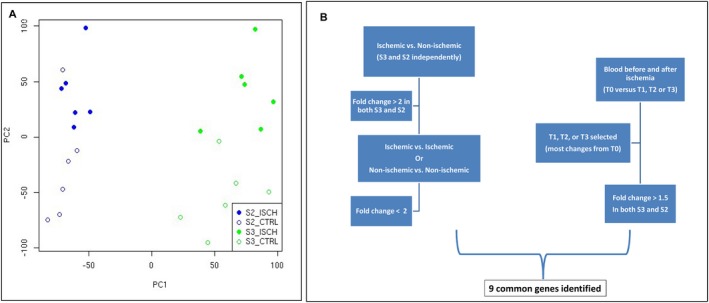
Figure 2.

Strategy of analysis and Principal component analysis. Comparison of transcriptome in the brain and the blood. Genes were labeled as “highly differentially expressed” if they had a fold change of more than 2 (log2 fold change greater than 1) in both monkeys when comparing ischemic and nonischemic brain samples, and had a fold change of less than 2 when comparing ischemic samples between monkeys or when comparing nonischemic samples between monkeys. Of the genes identified as highly differentially expressed in the brain, nine were also differentially expressed in the blood (fold change ≥ 1.5). Principal component analysis of the expression data on the two monkeys. The first two axes of variation (PC1 and PC2) are shown. The plots corresponding to the different monkeys are in different colors with the data from the ischemic side of the brain shown in filled circles.
