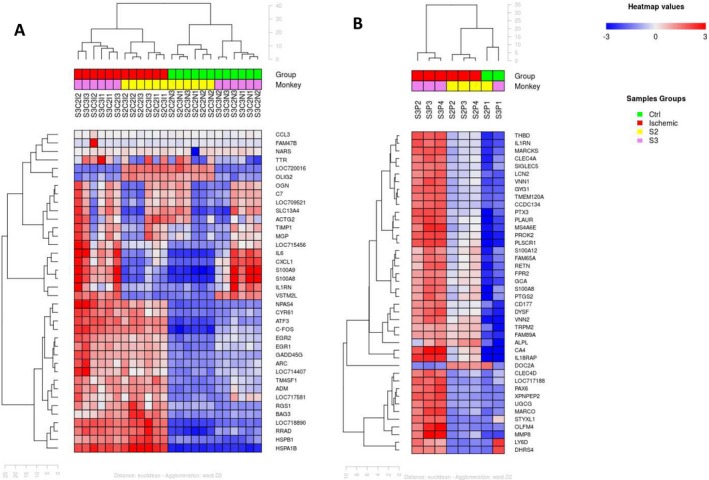
Figure 3.

Hierarchical clustering in the brain and the blood. Hierarchical clustering of the top variant genes (regardless of experimental condition) was performed for both brain (A) and blood (B). Ischemic and nonischemic brain samples cluster independently (A). Pre‐occlusion (T0) and post‐occlusion (T1, T2, T3) samples clearly cluster independently –B) for both animals (S2 and S3). For each monkey (S2 & S3), “I” represents ischemic sample, “N” represents nonischemic sample, “C” represents the level of the cut (2 or 3) and 1, 2 or 3 designate different cortical areas. For example: S2C3I2 represents monkey S2, cut C3, ischemia and region 2 of the cortex (XC) (see Figure 1).
