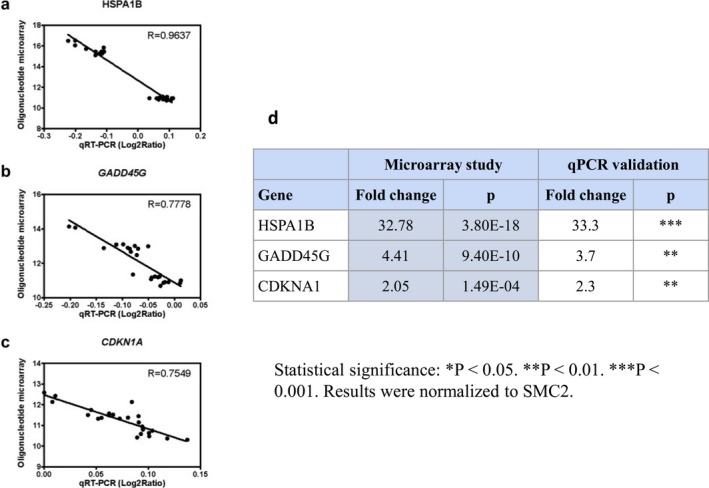
Figure 4.

Internal validation. Correlation between mRNA levels and microarray intensity values for HSPA1B (A), GADD45G (B) and CDKN1A (C) by qRT‐PCR. (A–C) Semi‐logarithmic scale; X axis: Log2 ratio of qRT‐PCR mRNA normalized for SMC2; Y axis: Oligonucleotide microarray signal. P value from Mann–Whitney U test. (D) Comparison of fold change between microarray study and qRT‐PCR mRNA of HSPA1B, GADD45G, and CDKN1A.
