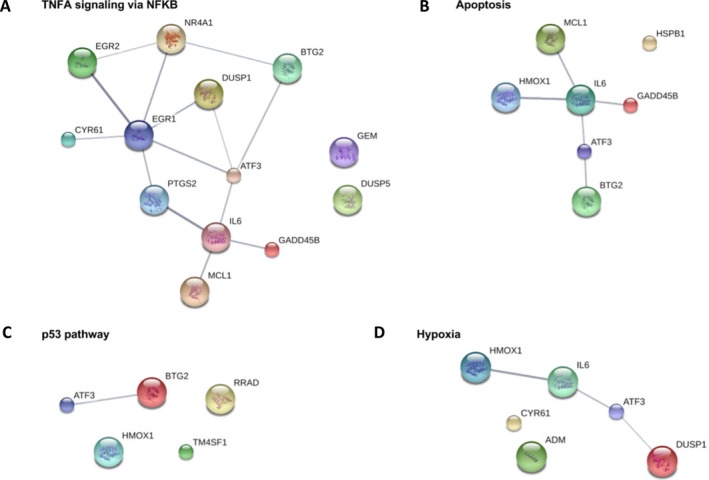
Figure 5.

Relationships of the top differentially expressed genes within the top GSEA gene sets. The gene set UV response up is not shown because none of the top differentially expressed genes from this set interact. Line thickness indicates STRING DB’s confidence of the interaction. Filled nodes indicate that information is known about the protein’s tertiary structure. (A) TNF‐α signaling via NF‐κB (B) Apoptosis (C) p53 pathway (D) Hypoxia.
