Figure 6.

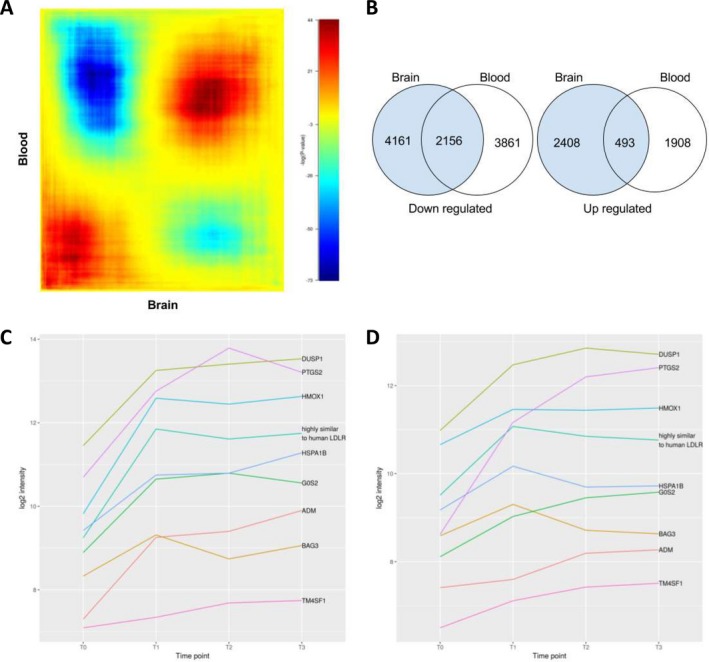
Overlaps of expressed genes in the brain and blood. (A) Heatmap of all possible overlaps of brain differentially expressed genes and blood differentially expressed genes (step size of 10,000).The log10‐transformed hypergeometric P‐values are indicated in the color scale bar with negative values indicating under enrichment. (B) Venn diagram of the most significant overlap between the two gene sets. Fisher's exact test based on the numbers displayed in the Venn diagram of Figure 6B found the overlap between the down‐regulated genes in the two tissues (2156 genes) highly significant (P = 5.43e‐20) as well as the overlap between the up‐regulated genes (493 genes, P = 7.79e‐19). For both tests, we used a background value of 20,217 (i.e., number of distinct genes on the array). Blood gene intensity kinetic in the blood for the 9 top overlapping expressed genes in the brain and blood in S3 (C) and S2 (D) between different time points: before (TO) and after (T1, T2 and T3) ischemia.
