
Figure 5.
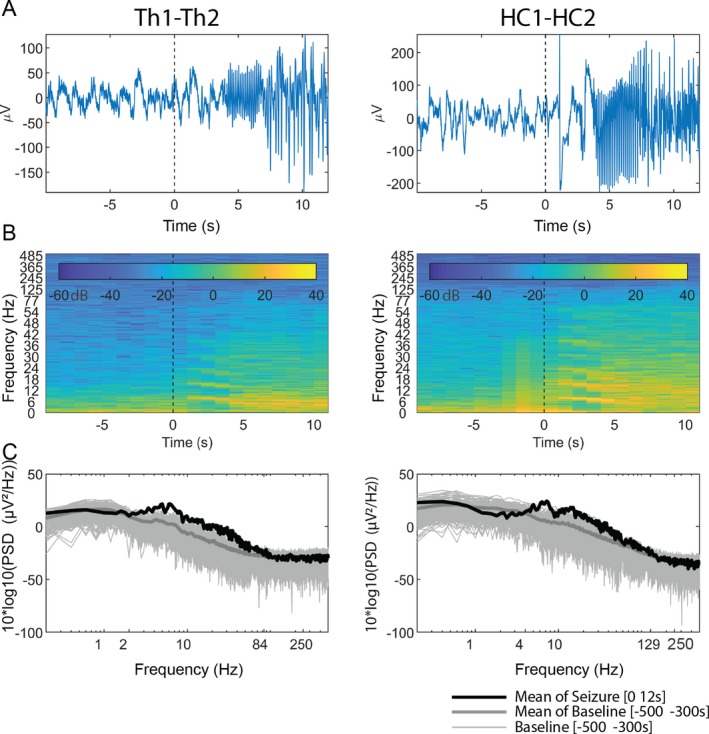
Changes in spectral power in SOZ and ANT at seizure onset. (A) stereo‐EEG recording from the hippocampus (HC) and ANT for first 10 seconds after seizure onset; (B) time–frequency decomposition of that sEEG signal; and (C) spectral power of that first 10 seconds after seizure onset. The baseline confidence represents a 95% confidence interval