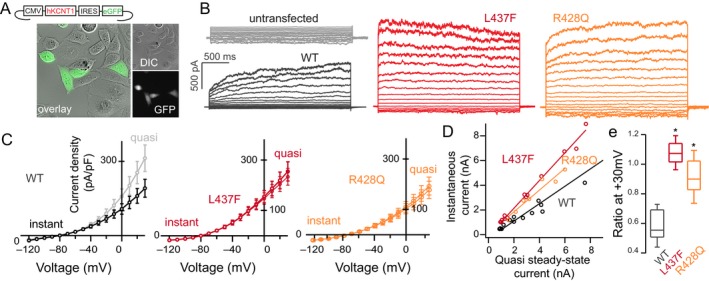
Figure 2.

Whole‐cell patch‐clamp recording of CHO cells expressing WT and mutant human KNa1.1 (A) Transfected cells selected for recording were selected by GFP expression and showed no change in morphology or cell health. (B) In comparison to untransfected cells, KCNT1‐expressing CHO cells exhibit a voltage‐dependent potassium current with relatively slow activation kinetics (black) as compared to the L437F variant (red) or the R428Q variant (orange), (C) evident in I–V curves drawn at initial depolarization (instantaneous current) and at 2s (quasi steady‐state). (D) This kinetic change is quantified by instantaneous:steady‐state ratio at a suprathreshold potential of +30 mV (n = 8–14 cells/group, P < 0.05, Kruskal–Wallis H‐test, (E). No significant difference in current density between WT and L437F or R428Q was noted (P > 0.1, Mann–Whitney U test).
