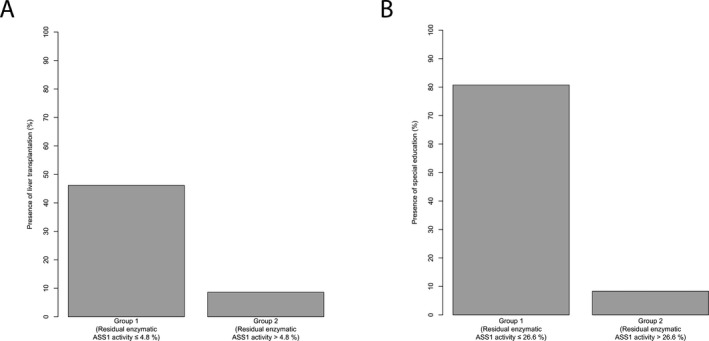
Figure 5.

Decision for liver transplantation and special education reflects risk‐stratification by residual enzymatic ASS1 activity. (A) Boxplot illustrating proportion of individuals (%) with a liver graft for those with a residual enzymatic ASS1 activity below or equal to 4.8% (n = 13) and above 4.8% (n = 58). Grey shading corresponds to individuals with liver graft in each group. Recursive partitioning, P = 0.011. (B) Boxplot displaying proportion of individuals (%) with special education for those with a residual enzymatic ASS1 activity below or equal to 26.6% (n = 26) and above 26.6% (n = 12). Gray shading corresponds to individuals with special education in each group. Recursive partitioning, P < 0.001. ASS1, argininosuccinate synthetase 1.
