Figure 2.

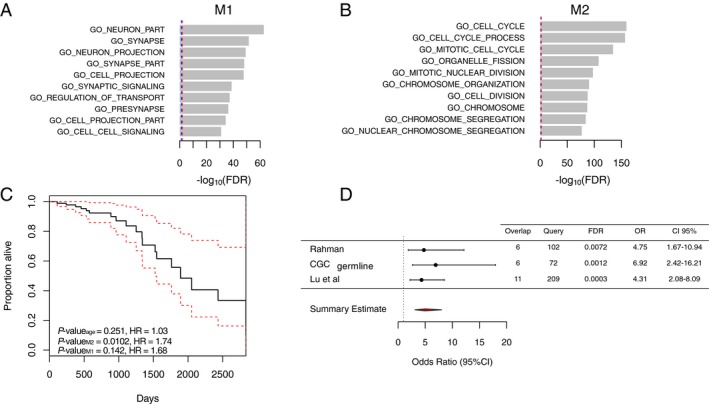
Characterization of modules M1 and M2. (A) Bar‐plot showing the functional enrichment of module M1 genes. The top enriched genes encode for genes annotated by GO as components of a neuron. (B) Bar‐plot of module M2 functional enrichment. The genes with cell cycle GO term were most significantly enriched. The x‐axis represents the significance of overrepresentation of biological pathway genes in modules calculated by the hypergeometric test. Blue‐dashed line represents FDR = 0.05, and red‐dashed line represents FDR = 0.01. (C) Estimated survival function for the Cox regression of time to death in AA cohort. Factors analyzed were the mean expression of module M2 and M1 in the AA and age at diagnosis. The dashed lines show point‐wise 95% confidence intervals around the survival function. Number of events = 19, censored = 55. (D) Forest plot showing the enrichment of M2 genes among cancer predisposition genes and genes harboring rare germline variants in cancer. The gene sets tested were derived from publications by Rahman33 (n = 102), and Lu et al.34 (n = 209), as well as germline mutations from COSMIC Cancer Gene Consensus (CGC)61 (n = 72). The figure shows the OR representing that the module M2 is more likely to contain genes from these gene sets than expected by chance with corresponding 95% confidence intervals. Overlap, number of query genes overlapping the module M2; Query, number of genes in each query list; OR, odds ratio; CI, confidence intervals.
