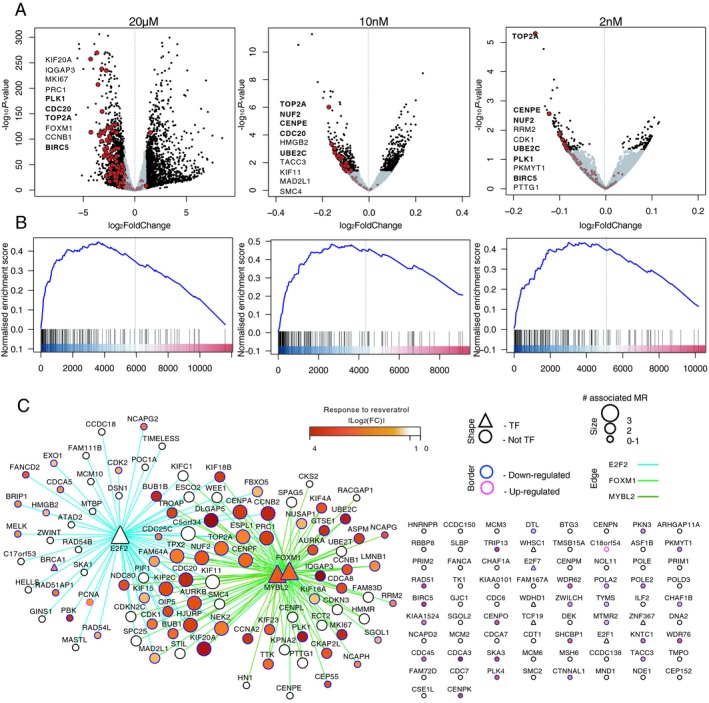
Figure 7.

Down‐regulation of module M2 genes by resveratrol. (A) Volcano plots showing the genes changing in response to resveratrol treatment in different concentrations (n = 3, TB98 cells). Genes with P‐value < 0.05 (10 nmol/L and 2 nmol/L treatment) or changed more than twofold (20 µmol/L treatment) are in black, module M2 genes are marked in red. Top 10 down‐regulated module M2 genes are labelled (P‐value ranked). M2 genes names among the top 10 down‐regulated genes in at least two assays are written in bold. (B) Gene Set Enrichment Analysis (GSEA) plots showing enrichment of module M2 genes among differentially expressed genes between DMSO and resveratrol treatment. Genes were ranked based on log10(fold change) × P‐value from the most up‐regulated to most down‐regulated genes. Positive normalized enrichment score indicates enrichment among the down‐regulated genes. (C) M2 network depicted as consensus TF – target interactions for MRs FOXM1, MYBL2, and E2F2. Differential expression in response to 20 µmol/L resveratrol treatment is shown in yellow to red (absolute log2 fold change value of gene expression between resveratrol and DMSO‐treated primary astrocytoma‐derived cells). Targets of FOXM1 and MYBL2 were strongly down‐regulated after 24 h treatment with 20 µmol/L resveratrol (TB98 cells). Network edges represent an interaction between MR and its target as inferred by MaRInA detected by ChIP‐seq (intersect). Edge colors are assigned to individual MR–target interactions. All TFs in the network are noted as triangles. The size of the node represents the number of MR–target interactions for a given gene and the border color symbolizes up‐ or down‐regulation in response to resveratrol.
