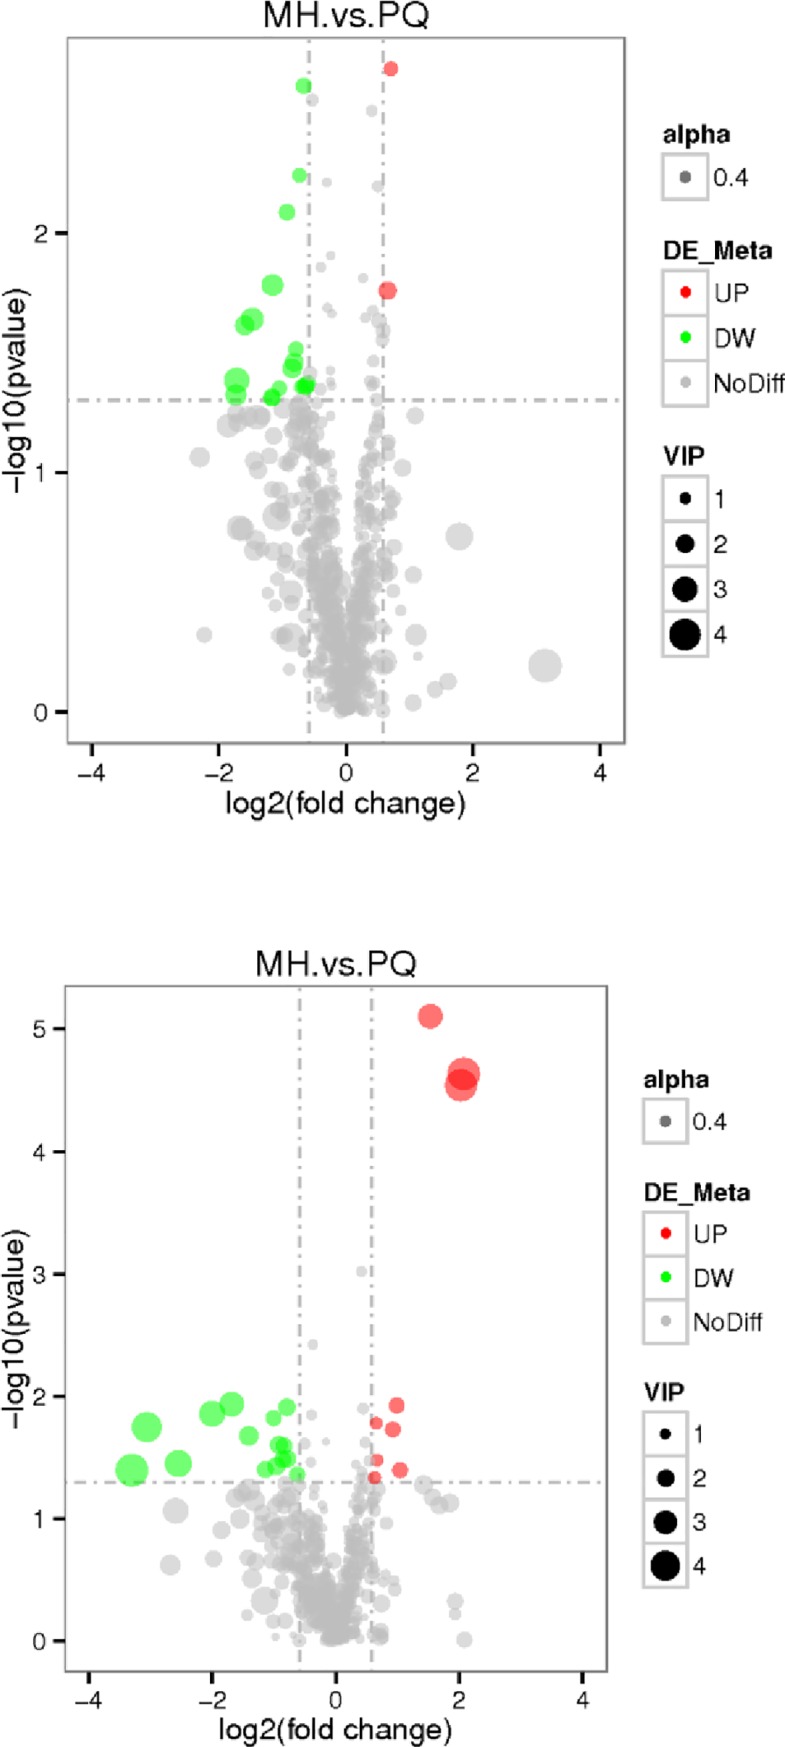
Fig 3. The volcano map of differential metabolites (the above figure represents the results were obtained under the MS positive ion model, and the below figure represents the results under the MS negative ion mode.

Red represents up-regulation, and green represents down-regulation in the MH group, gray represents there is no distinguished difference between the MH group and the PQ goup, and VIP represents the importance projection value of this substance obtained in the PLS-DA model compared in this group).
