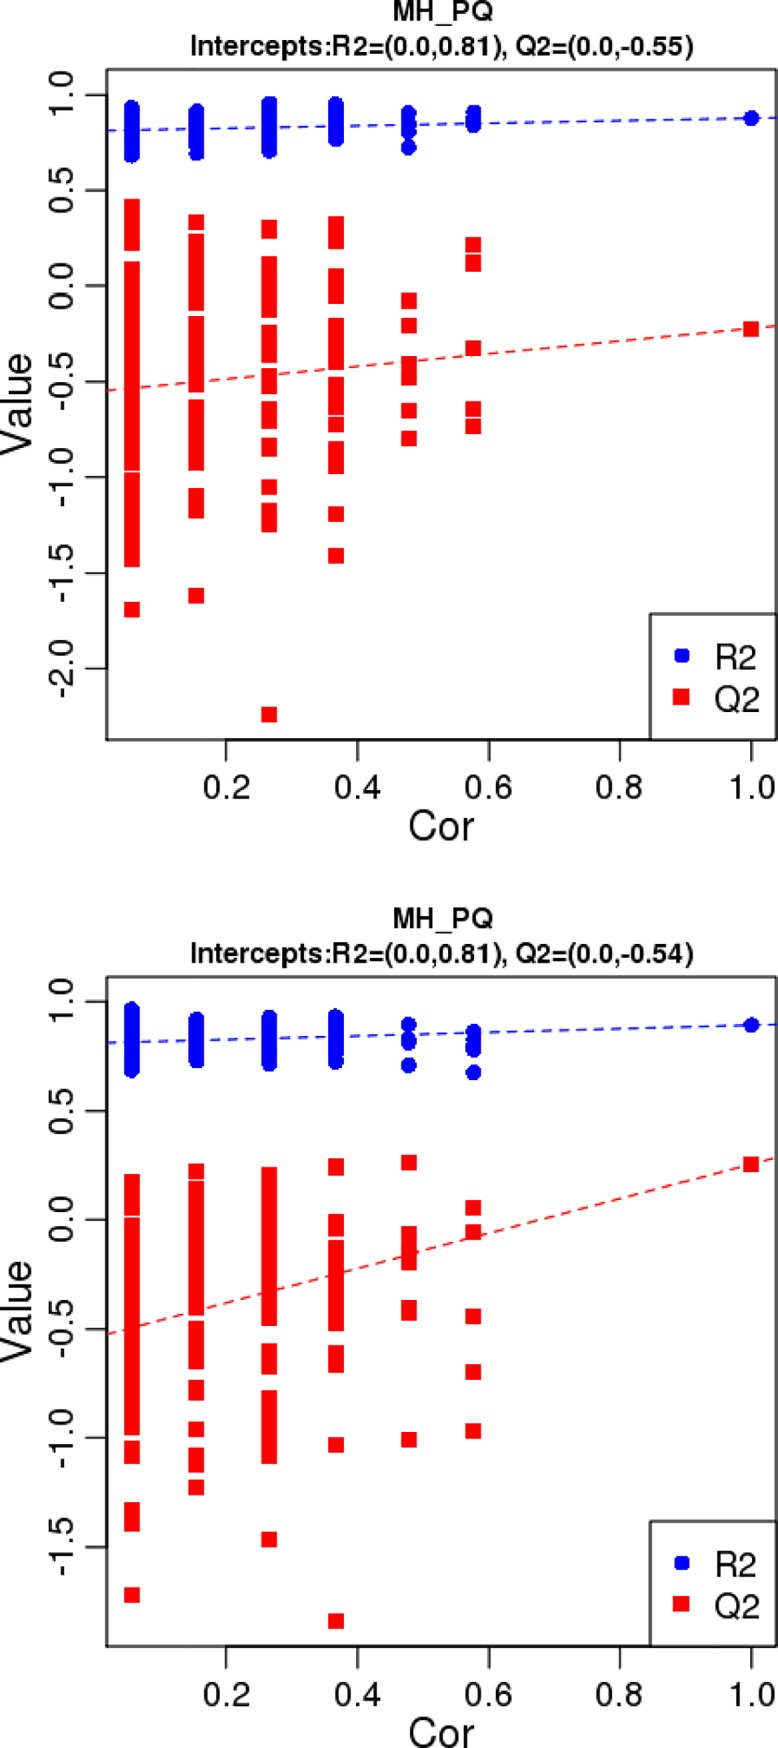
Fig 6. PLS-DA valid figure, the quality of the fitting model can be explained by R2 and Q2 values.

R2 displays the variance explained in the model and indicates the goodness of fit. Q2 displays the variance in the data predictable by the model and indicates the predictability. The above figure represents the results were obtained under the MS positive ion mode, and the below figure represents the results were obtained under the MS negative ion mode.
