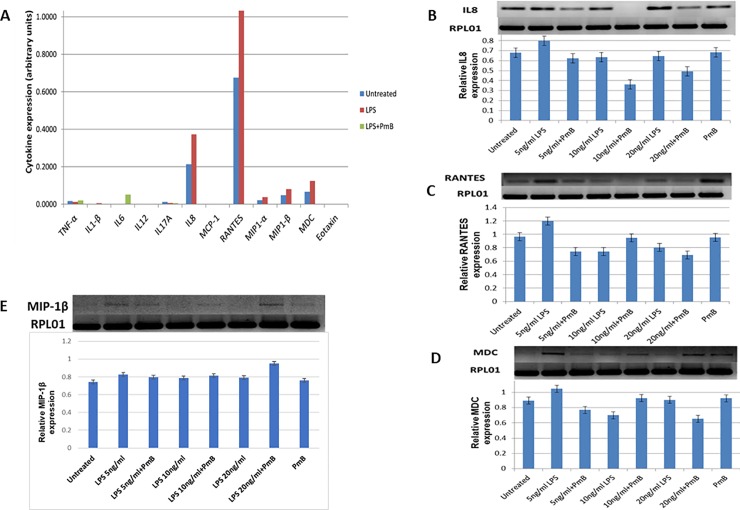
Fig 3. Lipopolysaccharide-induced cytokine profile.
A shows induction of cytokines using an ELISA array for measuring 12 cytokines (shown on the x-axis) following treatment with LPS (5 ng/ml) and polymyxin B (PmB) (10 μg/ml) for 24 hours in a single detection experiment. The absorbance (A570nm-A450nm) data were obtained using a Multiskan Go microplate spectrophotometer. B-E show RT-PCR for IL8, RANTES, MDC and MIP-1β expression following 24-hour treatment with permutations of LPS and PmB as indicated. Each RT-PCR result is quantified by densitometry shown in the lower panels. The data were normalised with reference gene, RPL01. The data are represented as mean ± SD from two independent experiments.

