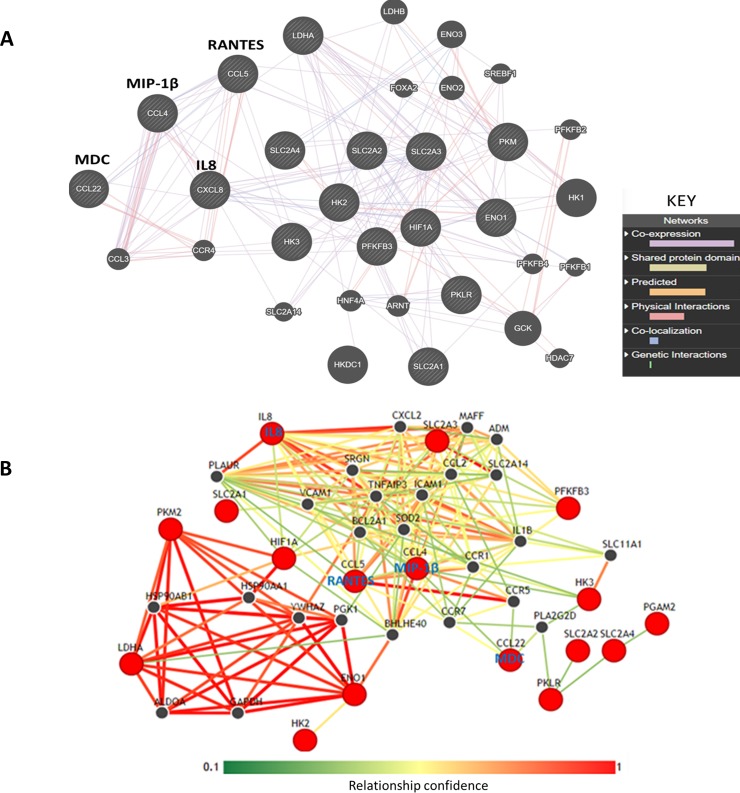
Fig 4. Interleukin 8, RANTES, MIP-1 beta and MDC show co-expression and other potential interactions with glycolytic enzymes.
The diagram shows gene interaction networks based on the upregulated cytokines. The interaction networks were generated using upregulated cytokines and glycolytic genes as input into the GeneMANIA and IMP webservers. A and B show interactions generated by GeneMANIA and IMP respectively. In A, the nodes represent genes while the edges represent interactions. All striped nodes show input genes while unstriped nodes represent other interacting genes. The predicted type of interaction is colour coded (see the inserted key). Interactions were considered statistically significant when an FDR (False discovery rate) value is < 0.05. FDR<0.05 represents a 5% chance of getting a false statistically significant result. GeneMANIA computes FDR values using the Benjamini-Hochberg procedure, which is built in the webserver. B shows predicted interaction network of the cytokines and glycolytic proteins using the IMP webserver. The relationship confidence bar shown on the figure gives the strength of the interaction based on network weights. This means that red edges represent stronger interaction confidence while green interactions show a weaker confidence. The red nodes represent input molecules while the black nodes represent other interacting proteins in the network.

