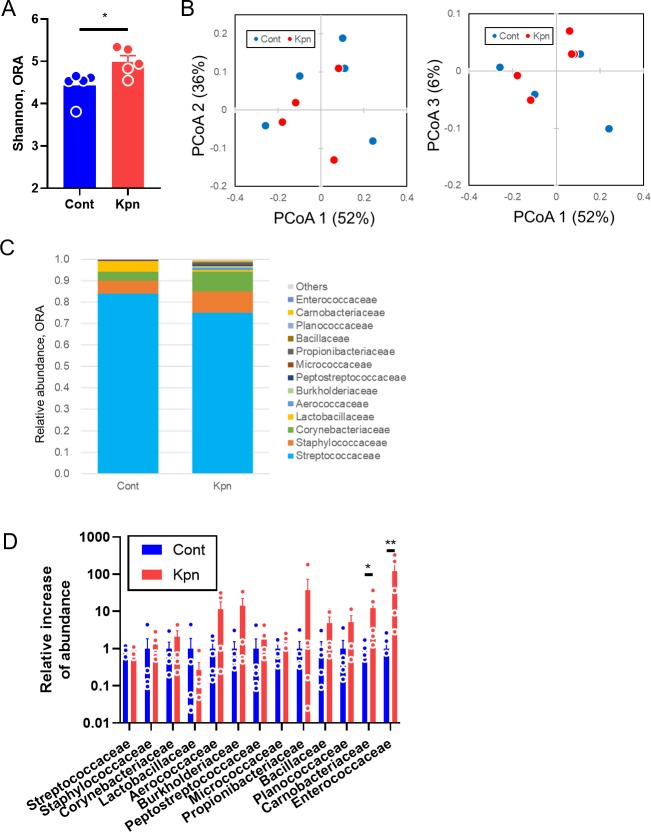
Fig 3. Oral microbiota after K. pneumoniae infection.
(A) Shannon index of oral swabs (ORA). (B) Weighted UniFrac with three principal coordinate components. The number in parenthesis represents the contribution of each component. (C) Taxonomic distribution at the family level. Only families with 0.1% or more abundance in at least one group are presented. (D) Relative change in abundance during pneumonia, compared to the case in control mice. Only families with 0.1% or more abundance in both groups are presented. Data represent two independent experiments. Five mice were used for each group. Filled circles represent individual mice, and each bar represents the mean ± SEM. PCoA, principal coordinate analysis. **, p<0.01. *, p<0.05. NS, not significant.

